

Thermal & Condition Intelligence
Detect electrical, mechanical, and structural faults 6-12 months before visible failure. Calibrated radiometric data, your engineering team can act on. Insurance-grade evidence your claims team can rely on.
10x ROI on predictive maintenance programs.
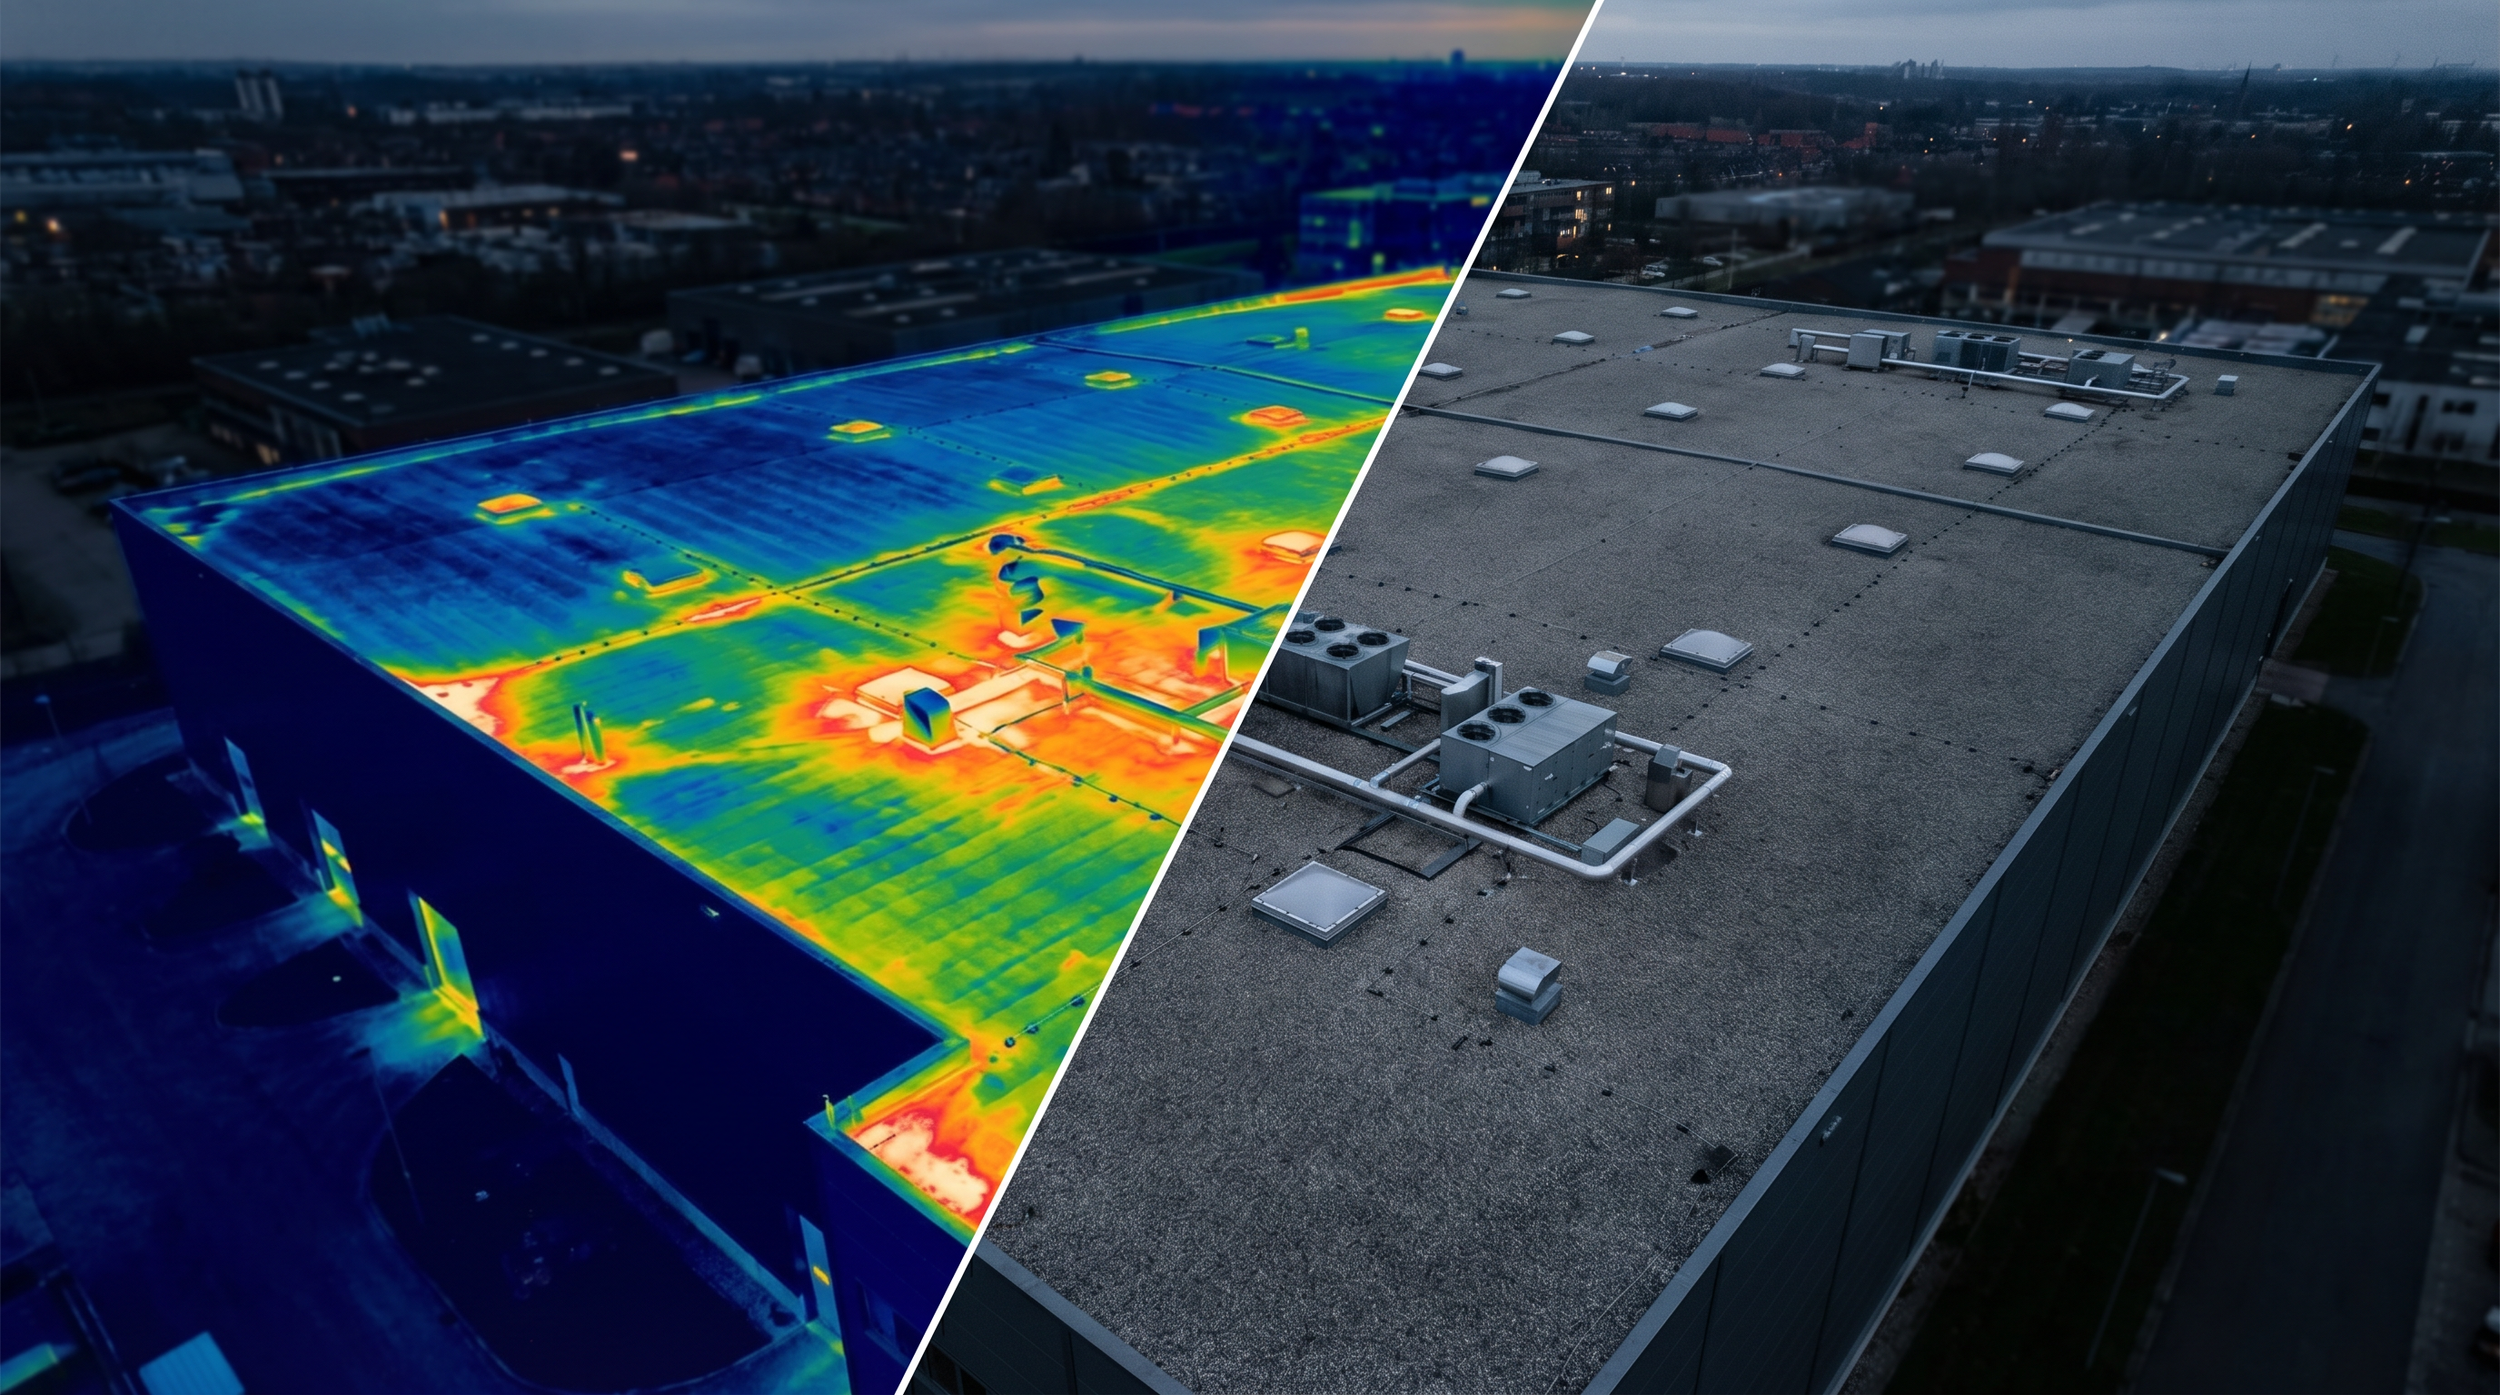
See Beyond the Visible

ISO 9001
|
ISO 14001
|
ISO 45001
|
CASA ReOC
|
$20m Insurance
|
Bridge Inspection L1
|
ISO 9001 | ISO 14001 | ISO 45001 | CASA ReOC | $20m Insurance | Bridge Inspection L1 |
The Cost of Unseen Failures
Reactive Maintenance Costs 3-5x More
Without predictive data, maintenance remains reactive. Each unplanned failure costs 3-5x more than a planned repair, plus production downtime, emergency callouts, and potential safety incidents. You Cannot Fix What You Cannot See:
Moisture ingress, insulation failure, electrical hot spots, and mechanical faults show no visible signs before catastrophic failure. Standard visual inspections miss 40-60% of developing defects.Insurance Claim Rejections & Fragmented
Insurance claims are frequently delayed or denied without calibrated, pre-loss condition evidence documenting the defect's origin and extent. Radiometric thermal data provides the auditable proof insurers require.10x
ROI on predictive maintenance programs98.5%
AI-powered defect detection accuracy6-12 months
Early warning before visible failure50-70%
Cost reduction vs traditional access methods±2°C
Calibrated measurement accuracy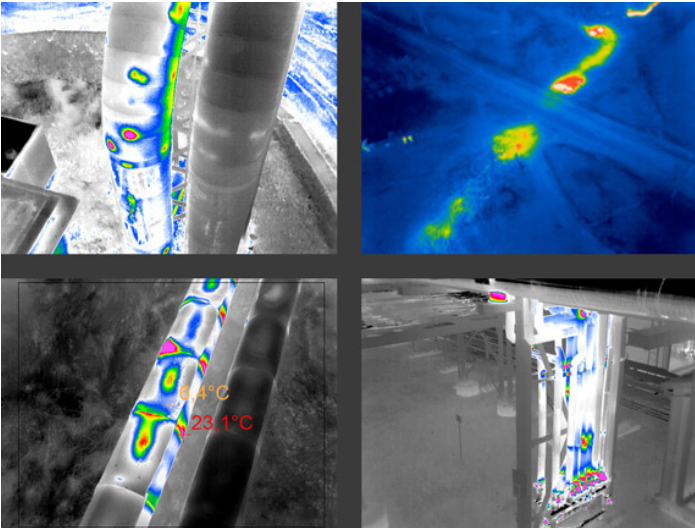
From Invisible to Actionable Condition Intelligence
One procurement. All Environments. All assets.
Stop managing multiple contractors. We cover aerial, ground, indoor, confined space, and underwater thermal inspections in a single, integrated program.Find faults invisible to the eye, radiometric thermal.
Capture: Radiometric thermal and high-resolution visual captured simultaneously across all environments. Every pixel records precise temperature data.Calibrate: Raw thermal data corrected for atmospheric conditions, emissivity, humidity, reflected temperature, and distance. Engineering-grade measurements accurate to ±2°C.Analyse: AI-powered defect detection classifies anomalies by type and severity. Thermal data overlaid onto 3D digital twin (enterprise reality modelling platform) for spatial context. Trend analysis against previous captures identifies degradation patterns.Deliver: Interactive 3D thermal model streamed via browser-based 3D viewer. Calibrated reports with defect register, severity classification, and recommended actions. Insurance-grade documentation.| Deliverable | What It Shows | Format |
|---|---|---|
| Calibrated Thermal Report | Defect register with severity classification, temperature readings, recommended actions | PDF (engineering-grade) |
| 3D Thermal Digital Twin | Thermal data overlaid on dimensionally accurate 3D model | Browser-based 3D viewer |
| Radiometric Orthomosaic | Full-site thermal map with calibrated temperature at every pixel | GeoTIFF |
| Visual + Thermal Overlay | Side-by-side and blended views for defect location | High-res imagery |
| Defect Register | AI-classified anomalies with type, severity, location, measurement | CSV + GIS-linked |
| Trend Analysis Report | Comparison against previous captures showing degradation patterns | Time-series charts |
| Insurance Evidence Pack | Calibrated pre-loss/post-loss documentation for claims | Certified PDF |
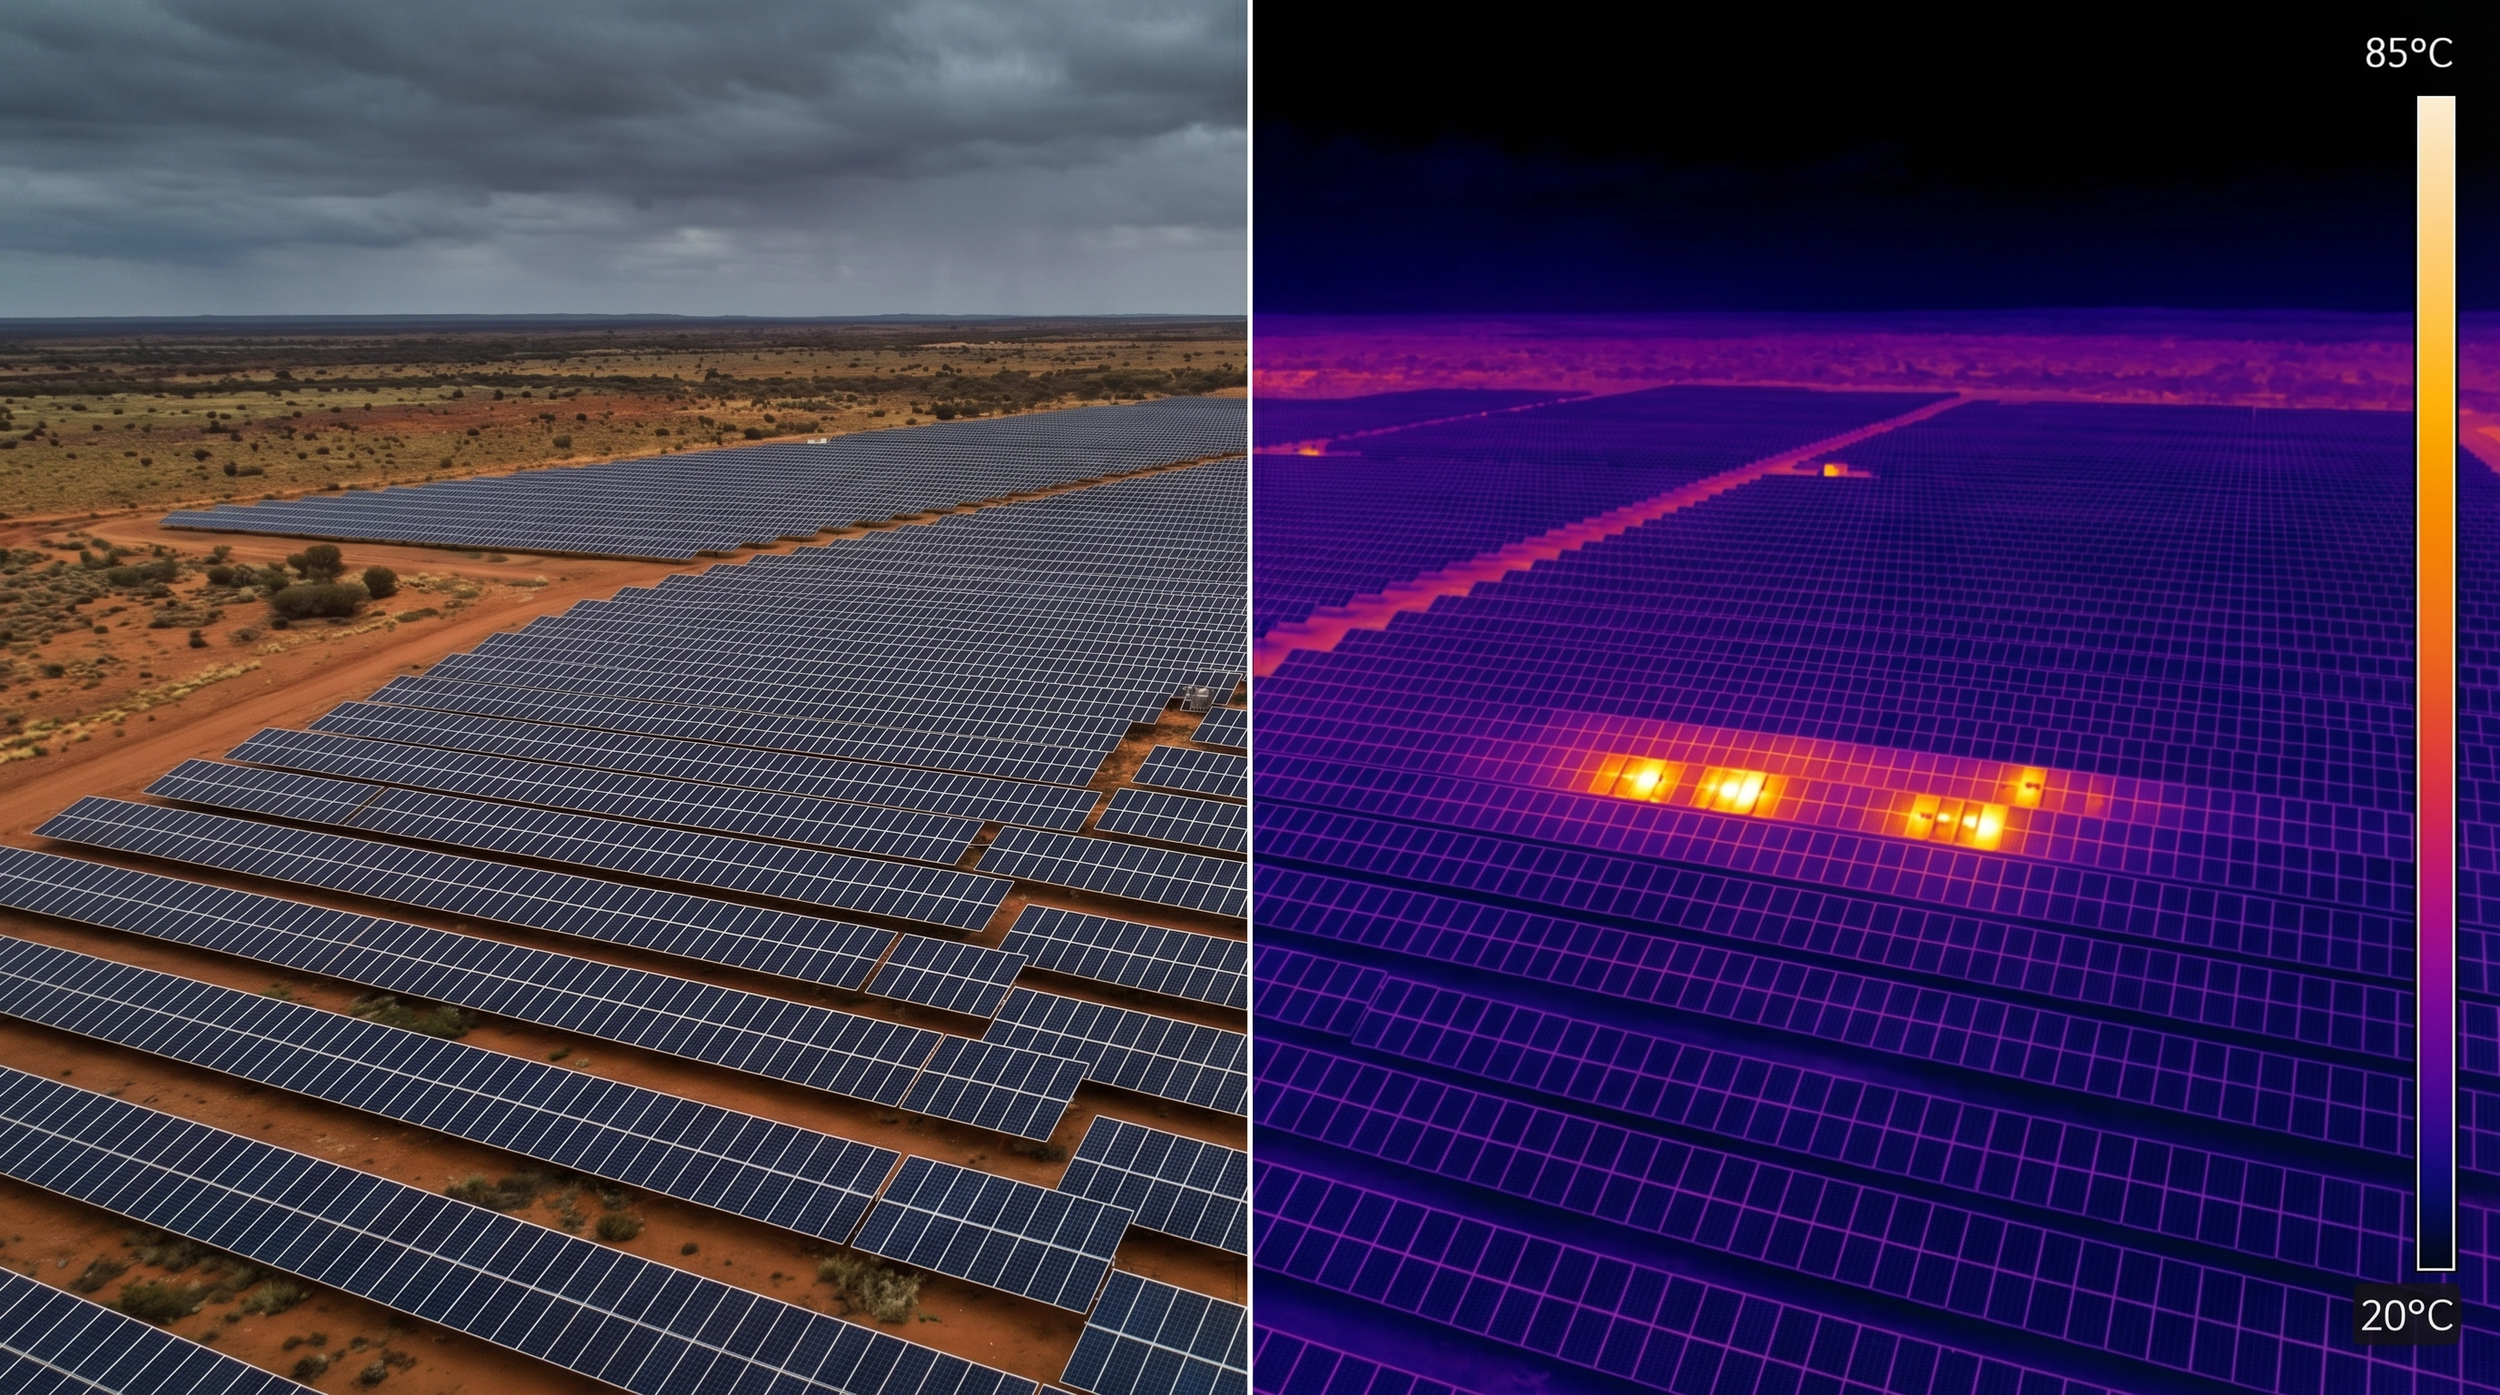
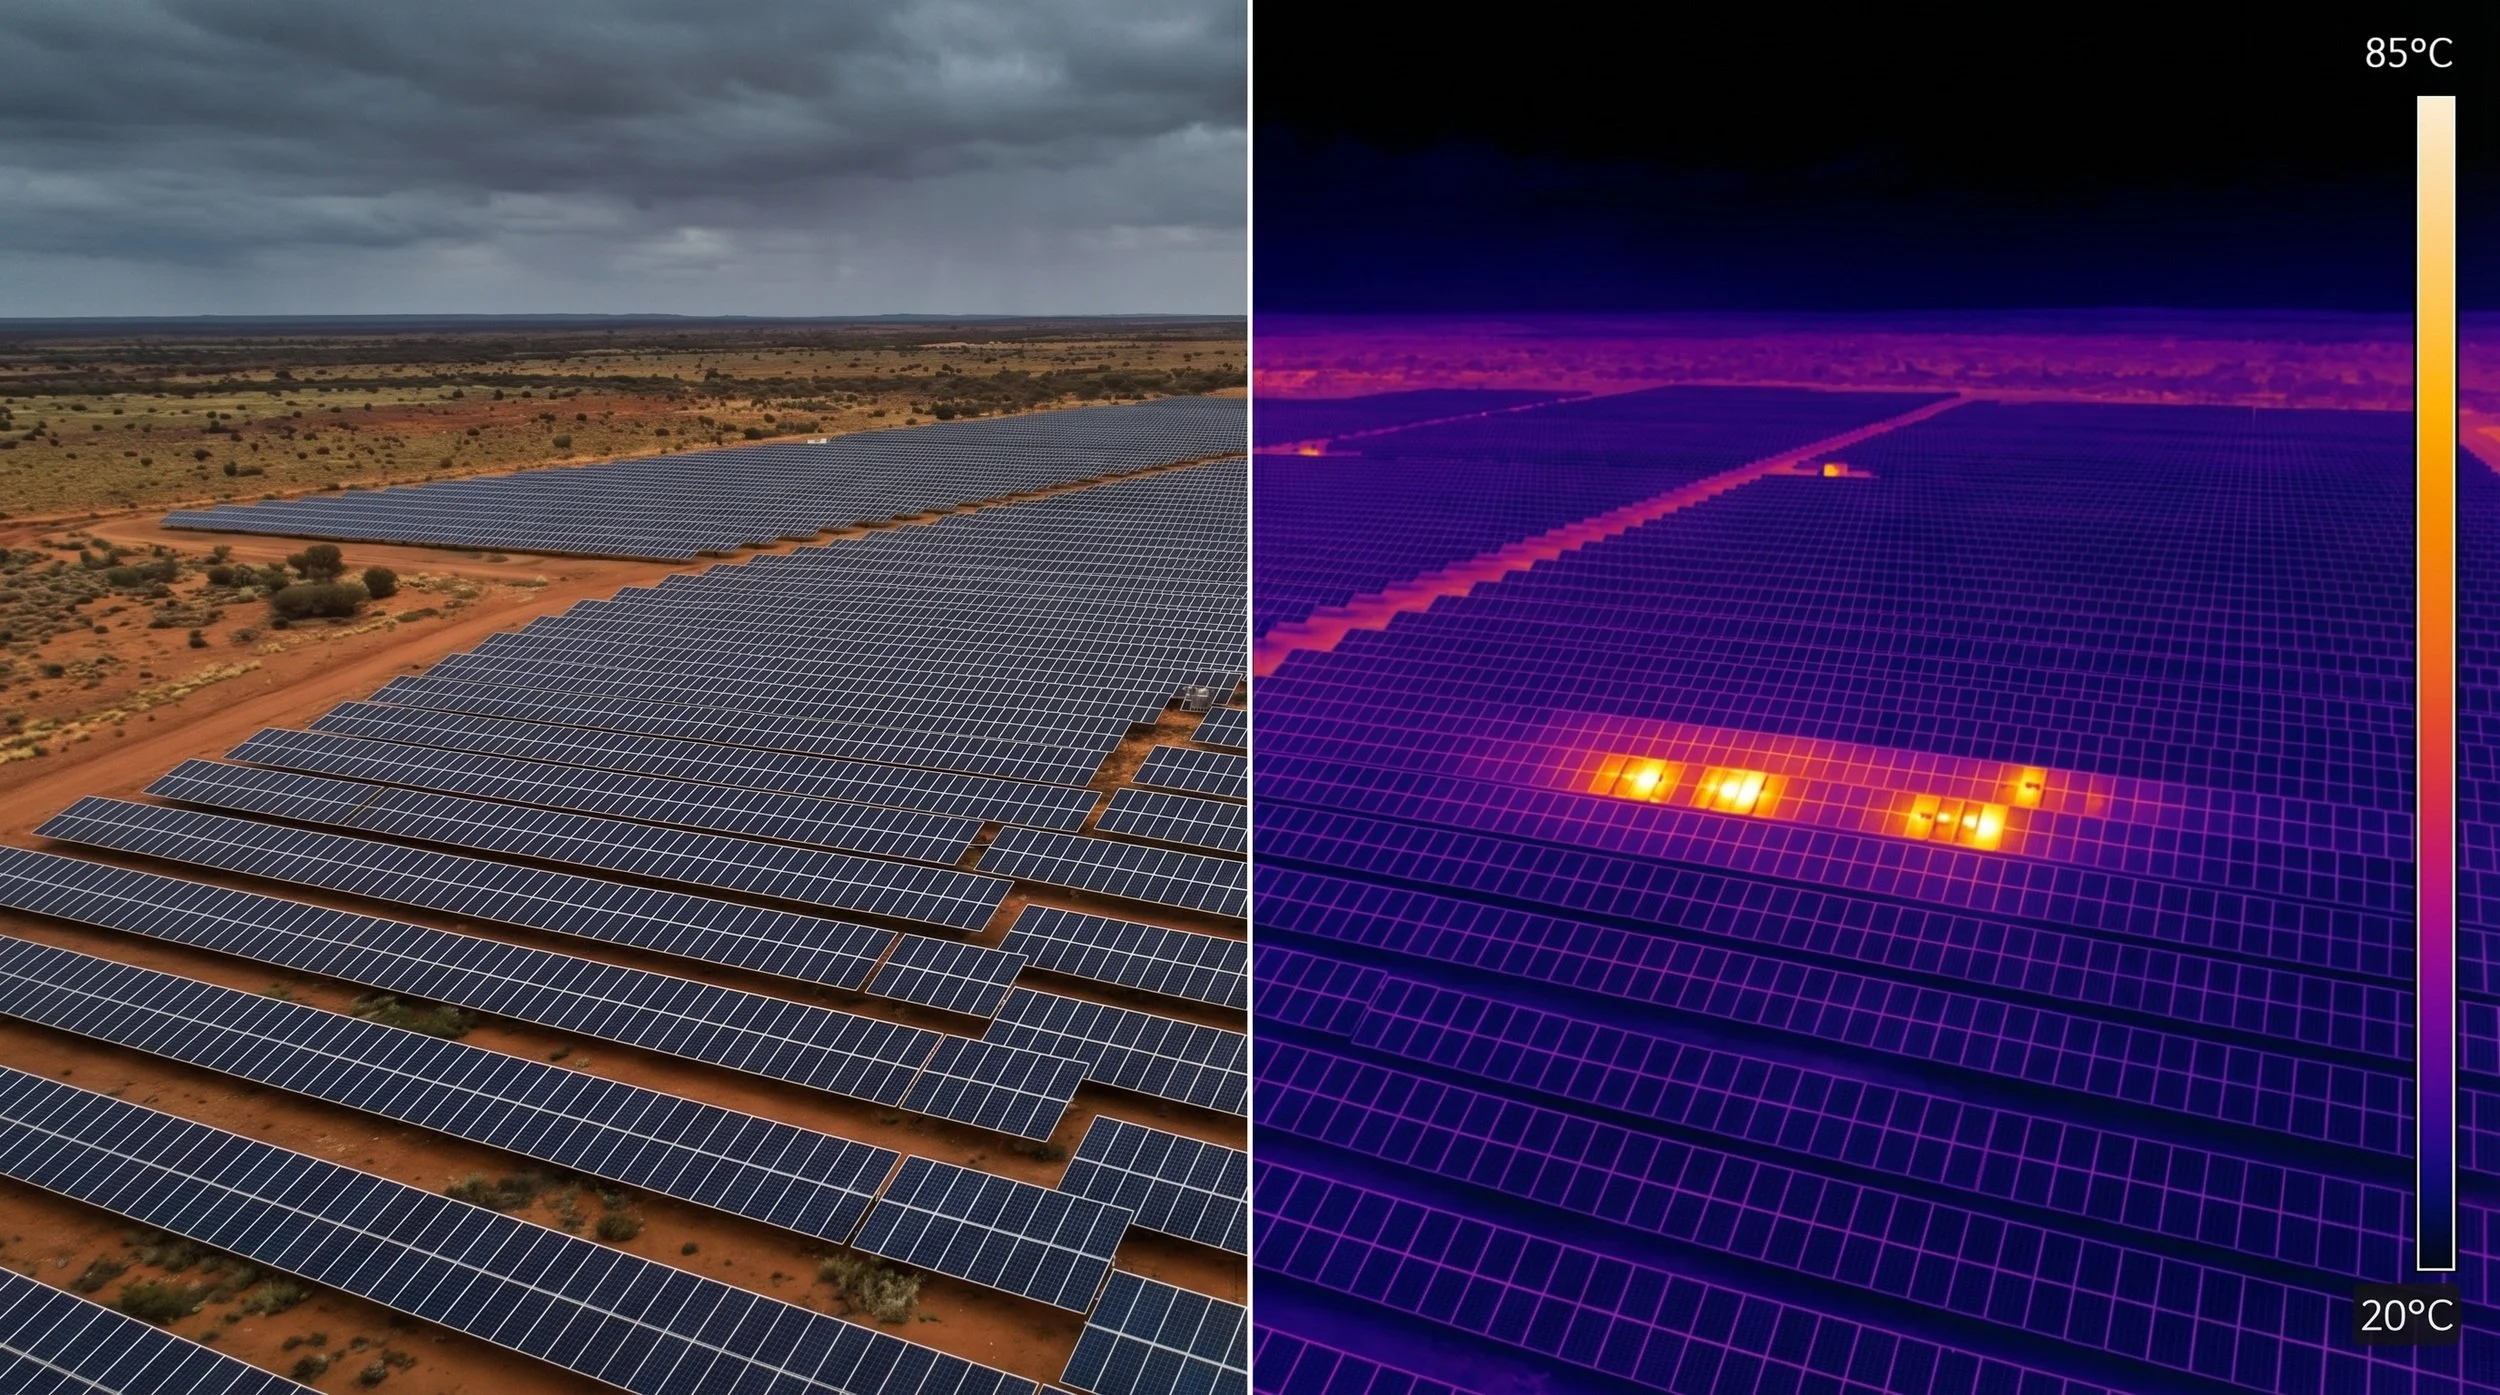
| Solar Panel Defect Map | Hot spots, bypass diode failures, PID, string failures mapped | GIS overlay |
Estimate Your Savings
Predict failures with trend analysis. Calibrated Sensors Across Every Environment
By establishing a thermal baseline, we track temperature changes over time to predict component failure, helping you move from reactive to predictive maintenance. Enterprise Aerial Platforms: 640×512 radiometric thermal sensor with < 30mK NETD sensitivity and 48MP visual camera. Covers 1 MW of solar panels in 15 minutes or 10 hectares per flight.Ground & Interior Radiometric: Handheld radiometric scanning integrated with 360-degree documentation. Overlaid onto LiDAR point clouds for spatial reference in switchboards and mechanical rooms.Confined Space Thermal (collision-tolerant confined space drone): Collision-tolerant drone with radiometric thermal payload and Ouster REV 7 LiDAR. Accesses 500mm minimum openings for internal tank and vessel inspections.Thermal Inspection Program Savings Calculator
Estimate the total value of transitioning from traditional to robotic thermal inspection across your facility.
Request Your Full Scoping Report
We'll prepare a detailed assessment based on your inputs above, including a tailored inspection program, timeline, and ROI analysis.
Detect faults 6-12 months before visible failure
The Value of Predictive Intelligence
40-60%
Improved Defect Detection
3-5x
Lower Costs vs Reactive Maintenance
Traditional Inspection vs Thermal Intelligence
| Factor | Traditional Visual Inspection | DeepSky IQ Thermal Intelligence |
|---|---|---|
| Defect detection | Visual only (misses 40-60% of developing faults) | Radiometric thermal (detects 98.5% of faults) |
| Early warning | None (find faults after failure) | 6-12 months before visible failure |
| Cost per asset | $5,000-$20,000+ (EWP, rope access, scaffolding) | $1,500-$6,000 (drone, no access equipment) |
| Coverage | Limited to accessible areas | 100% coverage including inaccessible areas |
| Working at height | Required (EWP, rope access, scaffolding) | Eliminated (60% less height exposure) |
| Data quality | Photos and written notes (subjective) | Calibrated radiometric data (±2°C, auditable) |
| Insurance evidence | Often insufficient for claims | Insurance-grade calibrated documentation |
| Measurement | Not possible from photos | Precise temperature at every pixel |
| Trend analysis | Not possible (no baseline data) | Time-series comparison showing degradation |
| 3D spatial context | No | Thermal data overlaid on 3D digital twin |
| Solar panel coverage | 2-3 days per MW (ground-based) | 15 minutes per MW (drone) |
| Report turnaround | 2-4 weeks | 5-7 business days |
Investing in a data-driven condition assessment program delivers clear, measurable returns by minimising risk and optimising operational expenditure.
98.5%
AI-Powered Detection Accuracy
Insurance-Grade Evidence That Protects Your Position
Pre-Loss Documentation (Proactive):
Establish a calibrated thermal baseline of your assets before incidents occur. When a claim arises, you have timestamped, engineering-grade evidence of the pre-existing condition.Post-Loss Assessment (Reactive):
After fire, flood, storm, or equipment failure, our thermal survey documents the full extent of damage including hidden moisture, structural compromise, and electrical damage invisible to visual inspection.Litigation Support:
Calibrated radiometric data is admissible as engineering evidence. Temperature measurements accurate to ±2°C, corrected for atmospheric conditions and emissivity, provide defensible documentation for disputes, negligence claims, and building defect litigation.Applicable Other Industries
Substation, solar farm analysis, bridges, facades, roof, mechanical, electrical, pipelines, and power line inspections.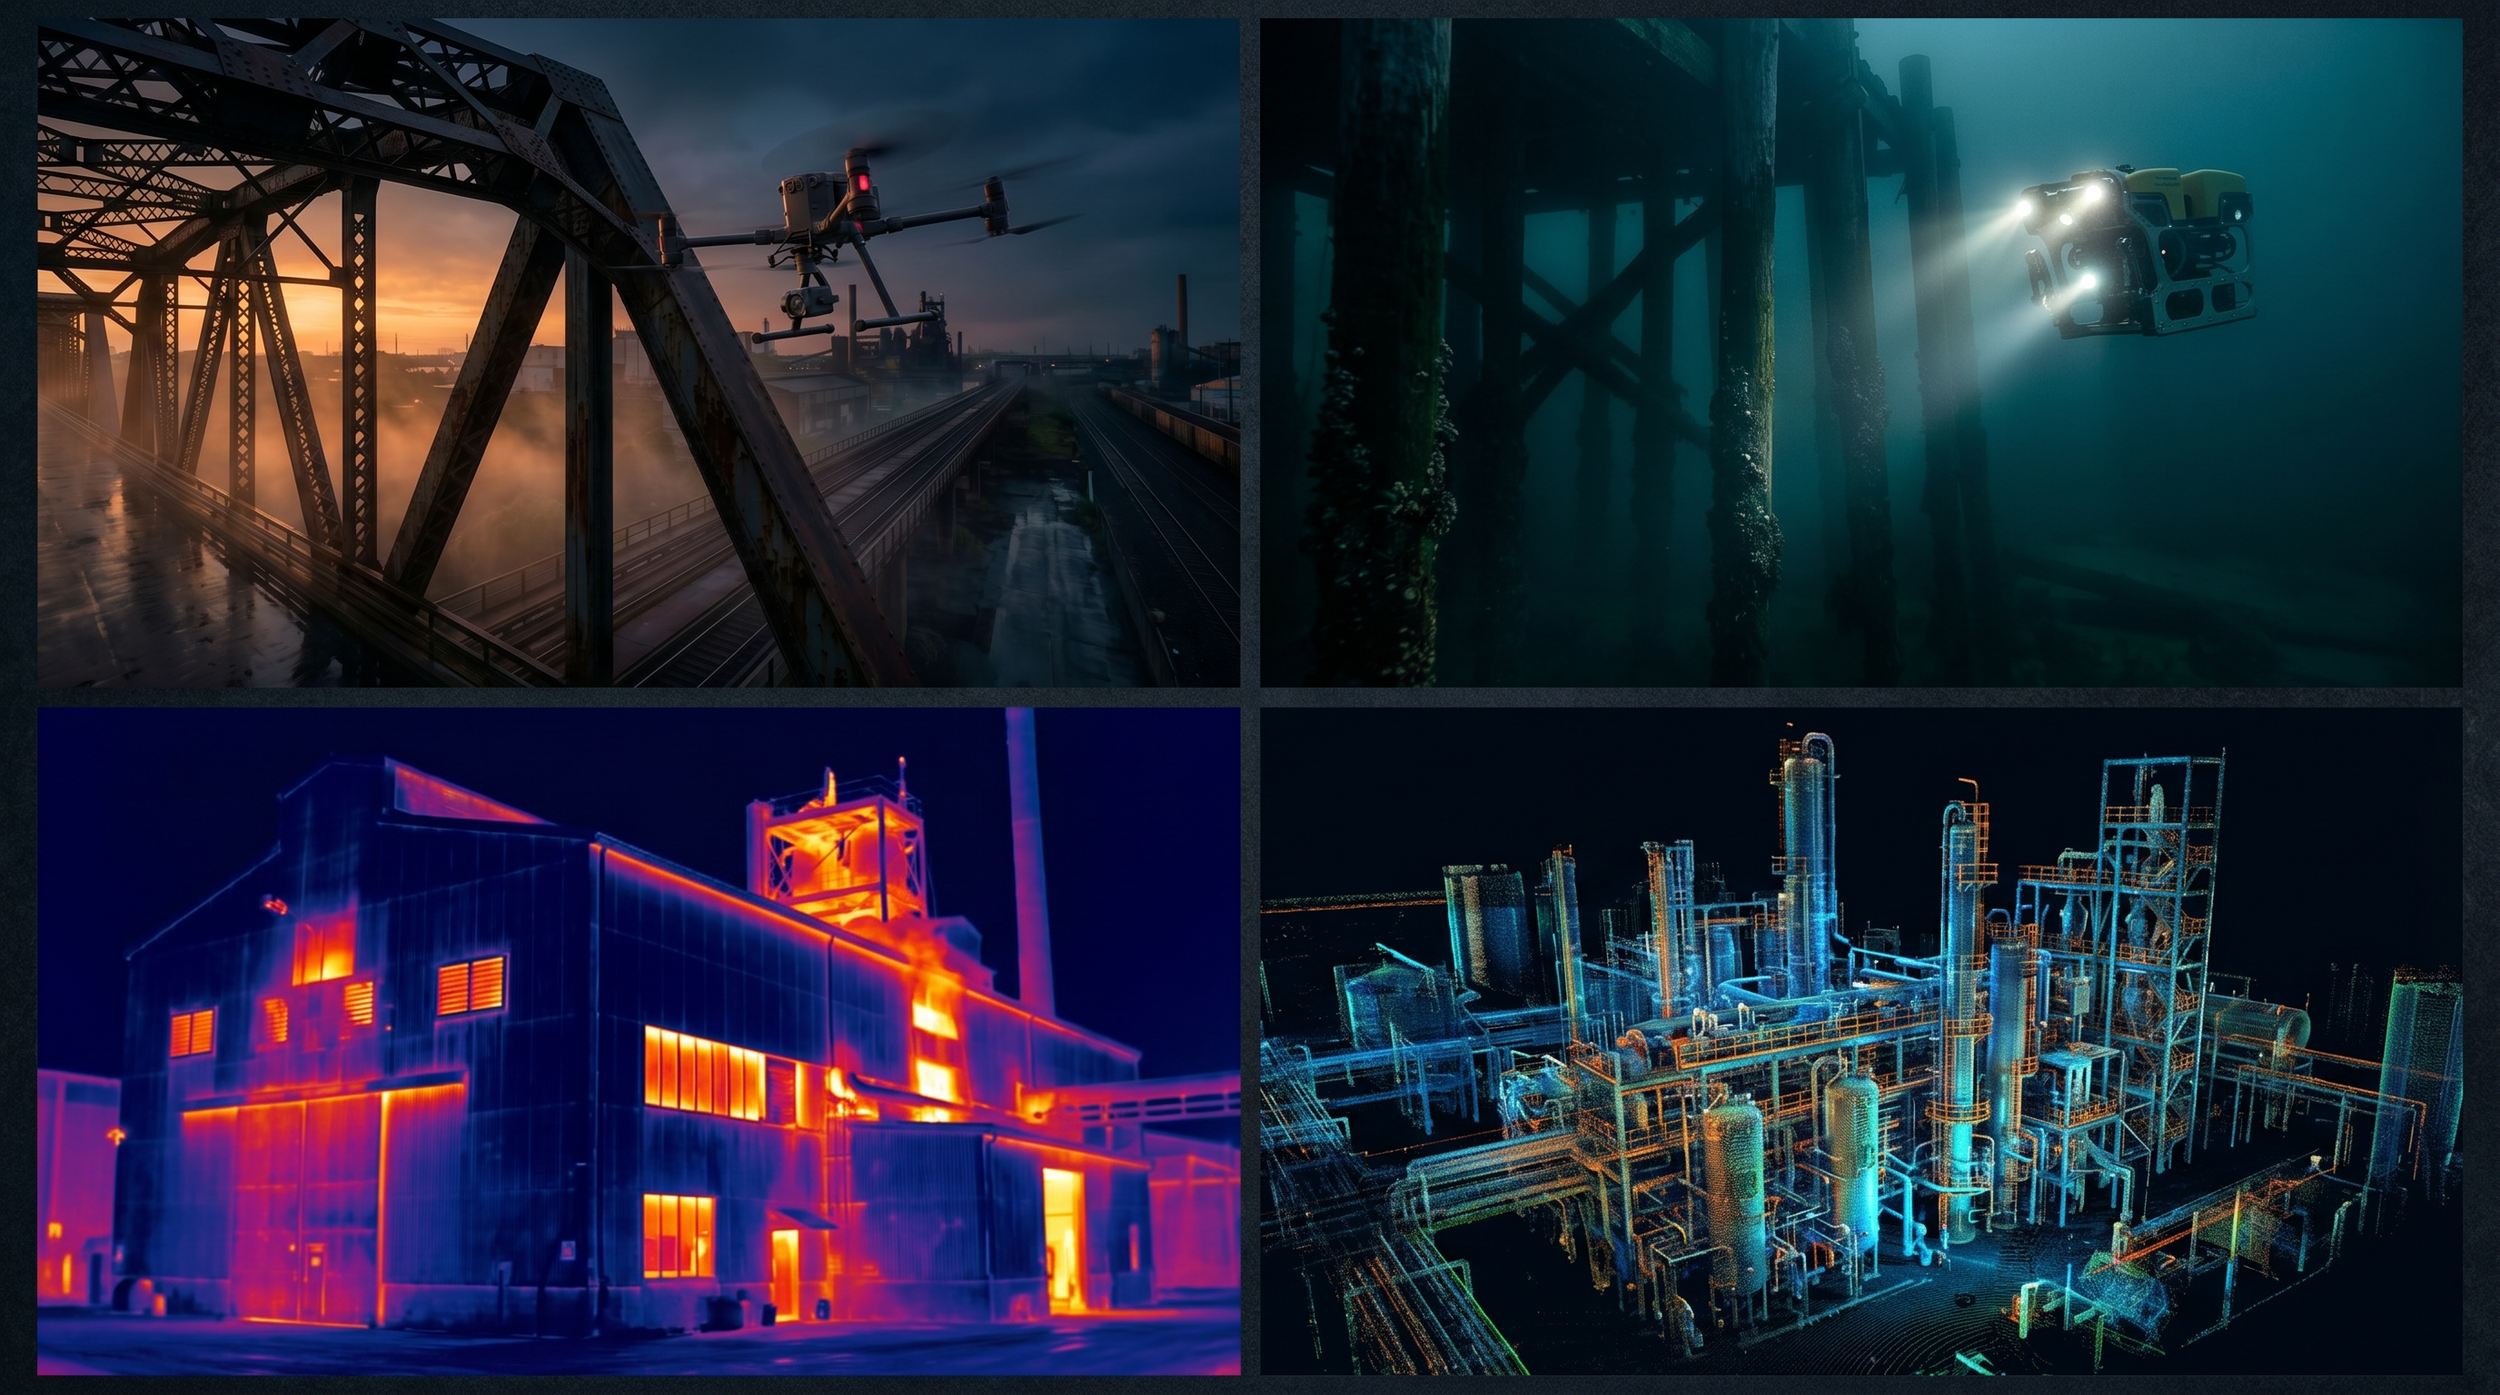
Property, Facilities & Portfolios
Building envelope audits, moisture detection, and electrical switchboard scans. 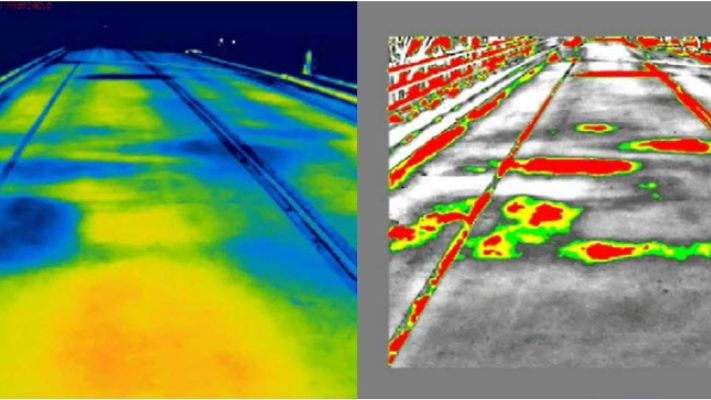
Bridge deck analysis, electrical infrastructure, pavement & facade assessment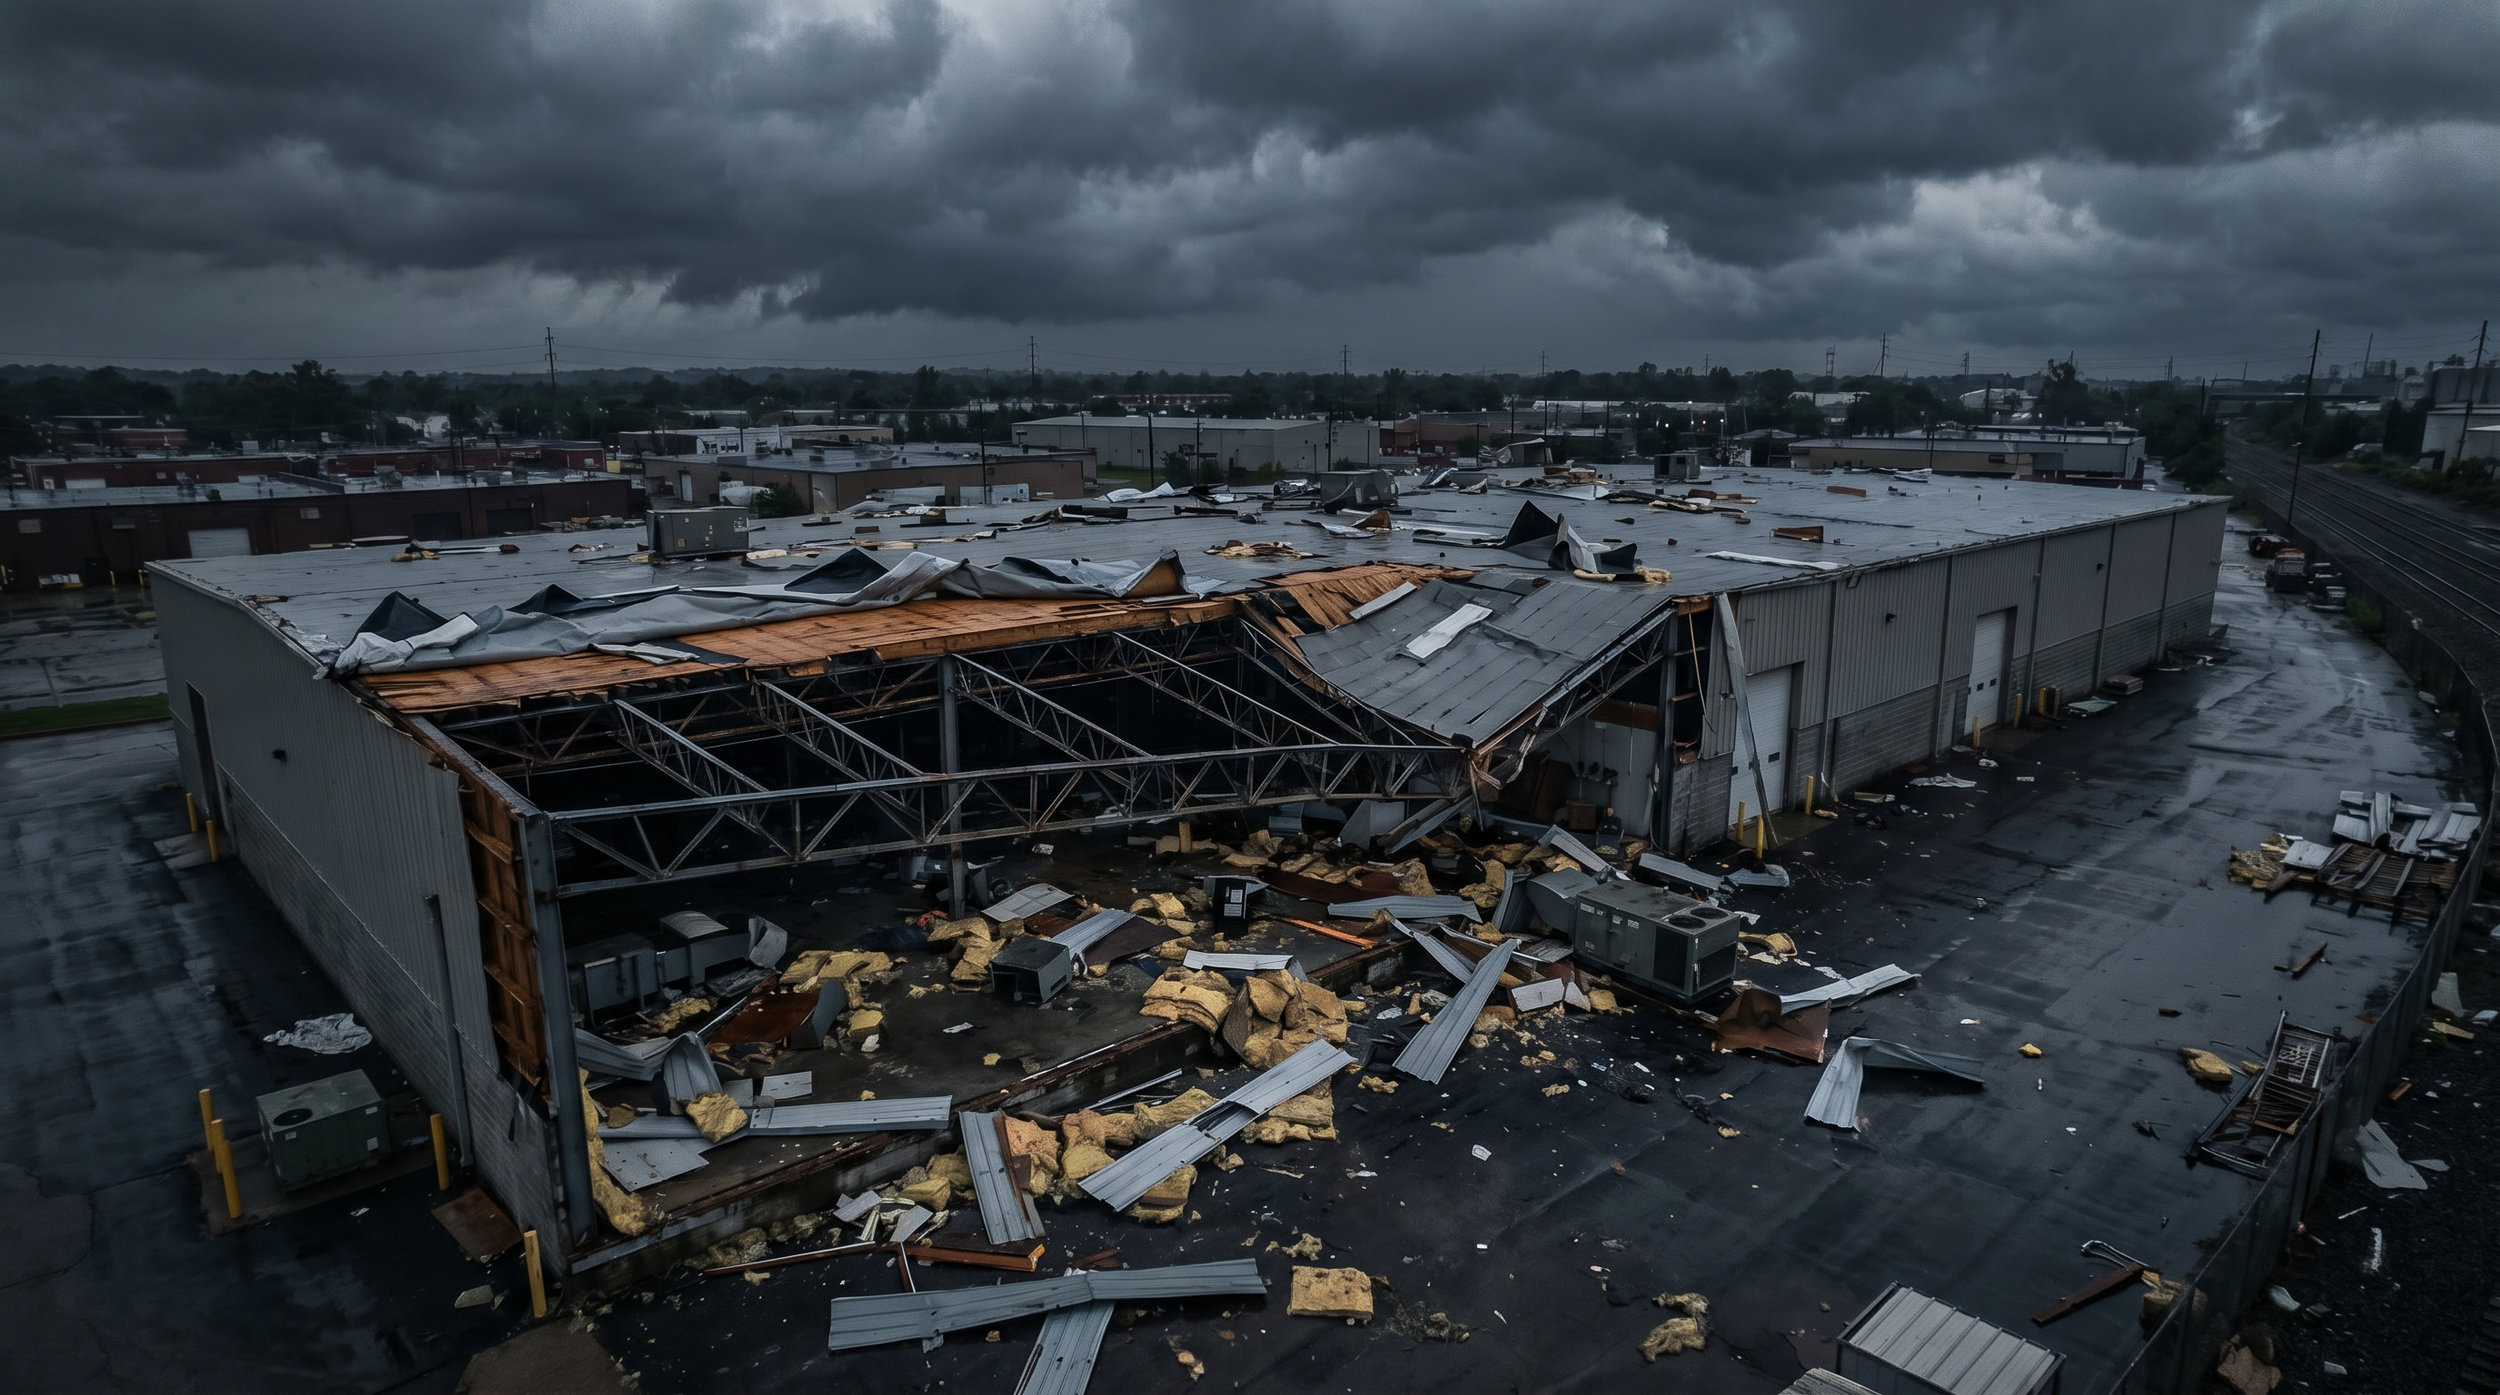
Complete scene "as was" data capture & analysis, digital twins, litigation communications, damage assessment, claims validation. & policy risk mitigationsFrequently Asked Questions
What is radiometric thermal imaging?
How often should thermal inspections be done for preventive maintenance?
Can thermal drones inspect solar panels?
It captures precise temperature data for each pixel, allowing for quantitative analysis. This is critical for identifying the severity of a fault and tracking it over time.What is the difference between radiometric and standard thermal cameras?
Standard thermal cameras show qualitative colour maps of relative temperature differences but cannot measure actual temperatures. Radiometric cameras capture precise, calibrated temperature data for every pixel. This enables engineers to quantify fault severity, track degradation over time, and produce auditable evidence for insurance claims and compliance reporting. Explore our data capture capabilities.Can you perform thermal inspections indoors or in confined spaces?
Yes. We deploy ground-based radiometric systems, handheld thermal imaging, indoor drones and robotics, and the collision-tolerant confined space drone to inspect switchboards, roof spaces, lift shafts, mechanical rooms, tanks, and vessels. This allows comprehensive inspection without requiring human entry into hazardous areas, improving safety and reducing downtime. What is a 3D thermal model?
High-resolution thermal data overlaid onto a dimensionally accurate 3D digital twin of your asset, processed through enterprise reality modelling platform and delivered via browser-based 3D viewer. Your team sees exactly where faults are in spatial context, measures distances, and plans repairs with centimetre-level accuracy from any web browser.By conducting regular condition assessments, we identify subtle temperature deviations that indicate developing faults. This trend analysis allows you to repair components before they fail.How much does drone thermal inspection cost in Australia?
How does thermal inspection support insurance claims?
Looking to stop reacting to failures and start predicting them. Discover how our thermal and condition intelligence programs can enhance safety, reduce costs, and improve the resilience of your critical assets.
How does thermal assessment support predictive maintenance?
Can thermal data be combined with visual inspection data?
Can thermal imaging detect water leaks and moisture ingress in buildings?
Is thermal imaging accurate for solar panel inspection, and what defects can it find?
Yes. We routinely overlay thermal imagery onto high-resolution visual orthomosaics, LiDAR point clouds, and 3D/8D models. This multi-sensor fusion provides a comprehensive view of both physical condition and thermal performance in a single interactive model for better decision-making, precise maintenance planning, and comprehensive asset management.Drone thermal inspection in Australia typically costs between $1,500 and $6,000 per building or asset, depending on the building's or asset's size, complexity, and reporting requirements. This compares to $5,000-$20,000+ for traditional methods using elevated work platforms, rope access, or scaffolding to achieve the same coverage. The 50-70% cost reduction comes from eliminating access equipment hire and traffic management, and from the 3-5x longer capture times of ground-based methods. For portfolio programs spanning multiple buildings, per-asset costs are further reduced through mobilisation efficiencies.Yes. Radiometric thermal imaging detects moisture ingress by identifying temperature differentials caused by evaporative cooling. Wet areas appear 2-5°C cooler than surrounding dry materials. This non-destructive method identifies leaks without opening walls or roofs, achieving 98.5% detection accuracy when combined with AI-powered analysis for early intervention.Industry best practice recommends annual thermal inspections for critical electrical infrastructure (switchboards, transformers, distribution boards, residential solar panels) and biennial inspections for building envelopes, roofing, and mechanical systems. For assets with known issues or high-consequence failures, quarterly or monthly monitoring establishes trend baselines that predict component failure in harsh environments such as mines, and in manufacturing plants, data centres, and commercial solar, with data available 6 months before any visible symptoms appear, significantly reducing unplanned downtime. This predictive approach reduces reactive maintenance costs by 3-5x and extends asset life by identifying degradation patterns early.Calibrated radiometric data provides auditable, engineering-grade evidence of pre-loss condition, post-loss damage extent, and defect severity. Temperature measurements accurate to ±2°C, corrected for atmospheric conditions, are admissible as engineering evidence in claims and litigation. This accelerates claims processing, eliminates disputes, and ensures fair settlements.Thermal imaging is the industry-standard method for solar panel inspection, detecting defects invisible to visual inspection, including hot spots, bypass diode failures, cell cracking, PID (Potential Induced Degradation), and string failures. A single drone flight can inspect 1 MW of solar panels in approximately 15 minutes, compared to 2-3 days using handheld methods. Studies show thermal drone inspection identifies 30-40% more defects than ground-based visual assessment, with each undetected hot spot potentially reducing panel output by 10-25% and creating fire risk.Yes. A single drone flight inspects 1 MW of solar panels in approximately 15 minutes, compared to 2-3 days using handheld methods. Thermal inspection identifies hot spots, bypass diode failures, cell cracking, PID, and string failures. Studies show 30-40% more defects found than ground-based visual assessment.