
Underwater ROV & Submerged Asset Intelligence
Engineering-grade data for your most critical submerged assets, to 500m deep.
Zero human risk. All Environments. One Asset. One Digital Twin
68% cost reduction vs traditional diver-based inspection.
ISO 9001
|
ISO 45001
|
ISO 14001
|
CASA ReOC
|
$20M Insured
|
Bridge Inspection L1
|
ISO 9001 | ISO 45001 | ISO 14001 | CASA ReOC | $20M Insured | Bridge Inspection L1 |
The Cost of Uncertainty Below the Surface
5x Higher Inspection Costs
Commercial diver inspections require support vessels, dive teams, decompression equipment, and extensive safety protocols. ROV-based programs deliver equivalent or superior data, faster and at up to 68% lower cost.100% Risk Exposure
Every diver deployment creates liability. Hazardous underwater environments, limited visibility, current, depth, and confined spaces compound risk. ROV inspections eliminate human entry entirely.Zero Baseline Data
Subjective, inconsistent diver reports make it impossible to track asset degradation over time. Without repeatable, measurable data, you cannot predict when a submerged asset will fail.Fragmented Data, Fragmented Picture
Multiple providers deliver incompatible formats on different timelines with no spatial correlation. No single view of asset condition above and below the waterline. One mobilisation, one coordinate system, one integrated dataset.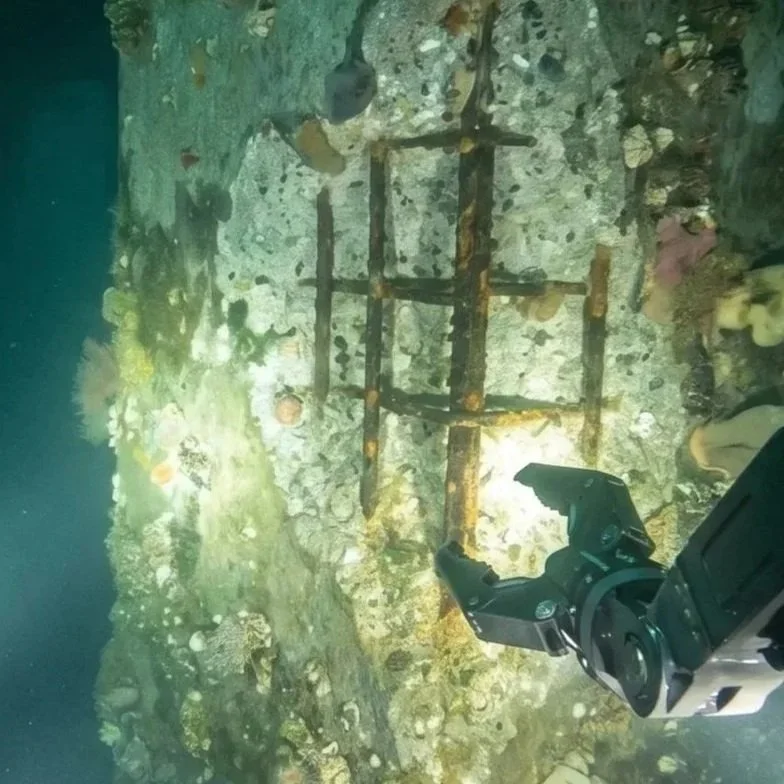
One Partner. Four Environments. Total Asset Intelligence.
AI-Powered Measurement
Dual-laser and AI algorithms measure fractures, corrosion depth, deformation, and crack propagation in real time. 99.7% accuracy without a diver in the water. Non-destructive, repeatable, and defensible. Repeatable Flight Paths
Autonomous navigation with inertial positioning (U-INS) ensures every survey follows the same path. This enables accurate degradation tracking over time, compare this year's data directly against last year's. Turbid Water Operation
When visual clarity is compromised by sediment, algae, or disturbed material, sediment filtering, multi-beam sonar and acoustic positioning systems navigate and capture detailed structural data regardless of visibility. The Value
5x lower cost
vs commercial dive teams20-40%
asset life extension via predictive maintenance (McKinsey)500m
depth capability with 4K AI-classified inspection100% coverage
vs 20-40% diver visual range per diveZero
human entry required4x faster
asset coverage per mobilisation30-50%
less unplanned downtime through digital twin condition monitoring80% less
weather dependency| Asset Type | Examples | Key Outcome |
|---|---|---|
| Bridge Substructures | Footings, piers, piles, abutments, scour assessment | Scour depth measurement, structural integrity rating, maintenance prioritisation |
| Port Infrastructure | Wharf piles, jetties, seawalls, berth structures, fenders | Corrosion mapping, remaining life estimate, compliance documentation |
| Dams & Reservoirs | Dam walls, spillways, outlet structures, capacity measurement | Volumetric capacity calculation, crack propagation tracking, ANCOLD compliance |
| Ship Hulls | Hull condition, propellers, rudders, sea chests, anodes | Class survey evidence, biofouling assessment, dry-dock interval extension |
| Pipelines & Cables | Subsea pipelines, cable crossings, burial depth verification | Span detection, burial depth confirmation, cathodic protection assessment |
| Water Infrastructure | Water tanks, reservoirs, intake structures, penstocks | Sediment depth measurement, lining condition, capacity verification |
| Marinas & Moorings | Pile condition, mooring systems, pontoon structures | Pile wastage measurement, mooring chain wear, replacement scheduling |
| Coastal Structures | Breakwaters, groynes, revetments, outfall structures | Armour displacement tracking, toe scour assessment, storm damage documentation |
| Seabed | Mapping, debris surveys, pre-construction surveys | Bathymetric charts, obstruction clearance, geotechnical planning support |
| Environmental | Coral reef monitoring, habitat assessment, marine growth | Baseline documentation, offset compliance evidence, temporal change detection |
Examples of what you can receive
What You Receive
| Deliverable | What It Shows | Format |
|---|---|---|
| 4K UHD Video | Complete visual record of all inspected surfaces | MP4 time-stamped geo-referenced |
| 12MP RAW Photography | High-resolution stills of defects and general condition | RAW JPEG |
| 3D Underwater Digital Twin | Dimensionally accurate 3D model (2cm accuracy) | Browser-based 3D viewer |
| Defect Register | AI-classified anomalies with type, severity, location, measurement | CSV GIS-linked |
| Condition Report | Structured engineering report with severity ratings and recommendations | |
| Bathymetric Map | Seafloor topography, depth contours, capacity estimates | GeoTIFF DXF |
| Measurement Data | Crack widths, corrosion depths, deformation measurements (99.7% accuracy) | CSV Annotated imagery |
| Unified Model | Above + below waterline combined (aerial drone + ROV) | Browser-based 3D viewer 3D Tiles |
| Trend Comparison | Side-by-side comparison with previous inspections | Time-series report |
| Live Asset Health Dashboard | Real-time condition scores, sensor alerts, and degradation indicators in a single view | Browser-based dashboard |
| Automated Change Detection | AI comparison between inspection epochs highlighting new defects, growth, and movement | Annotated 3D model Change report |
| Risk-Prioritised Work Orders | Condition data converted to severity-ranked maintenance actions with cost estimates | CSV CMMS-compatible |
| IoT Sensor Overlay | Corrosion probes, strain gauges, water level, and tilt sensors mapped onto the digital twin | Real-time dashboard |
| Lifecycle Cost Forecast | Predicted maintenance costs and replacement timing based on measured degradation rates | PDF Interactive model |
| Regulatory Compliance Pack | Inspection evidence structured for ANCOLD, DNV, AMSA, or port authority submission | Certified PDF Data package |
Calculate Your Savings
Receive a detailed cost comparison, risk reduction value, data quality improvement, 3D digital twin value, multi-year program pricing, compliance alignment, and recommended inspection frequency by asset type.Underwater Inspection & Asset Intelligence Calculator
Estimate the total value of transitioning from traditional dive teams to an integrated ROV + digital twin asset management program.
Request Your Full Scoping Report
We'll prepare a detailed assessment based on your inputs above, including a tailored inspection program, digital twin integration plan, timeline, and ROI analysis.
See how our integrated approach can reduce your inspection costs and eliminate safety risks.Underwater Intelligence Across Every Sector
Bridge substructure condition assessment (footings, piers, scour). Culvert and drainage structure inspection. Road/rail bridge pile condition monitoring. Compliance with AS 5100 Bridge Design standards. Scour depth measurement and progression tracking. Bridge substructure 3D models integrate with above-deck aerial data to create a complete bridge digital twin. Engineers assess the entire structure from one interactive model.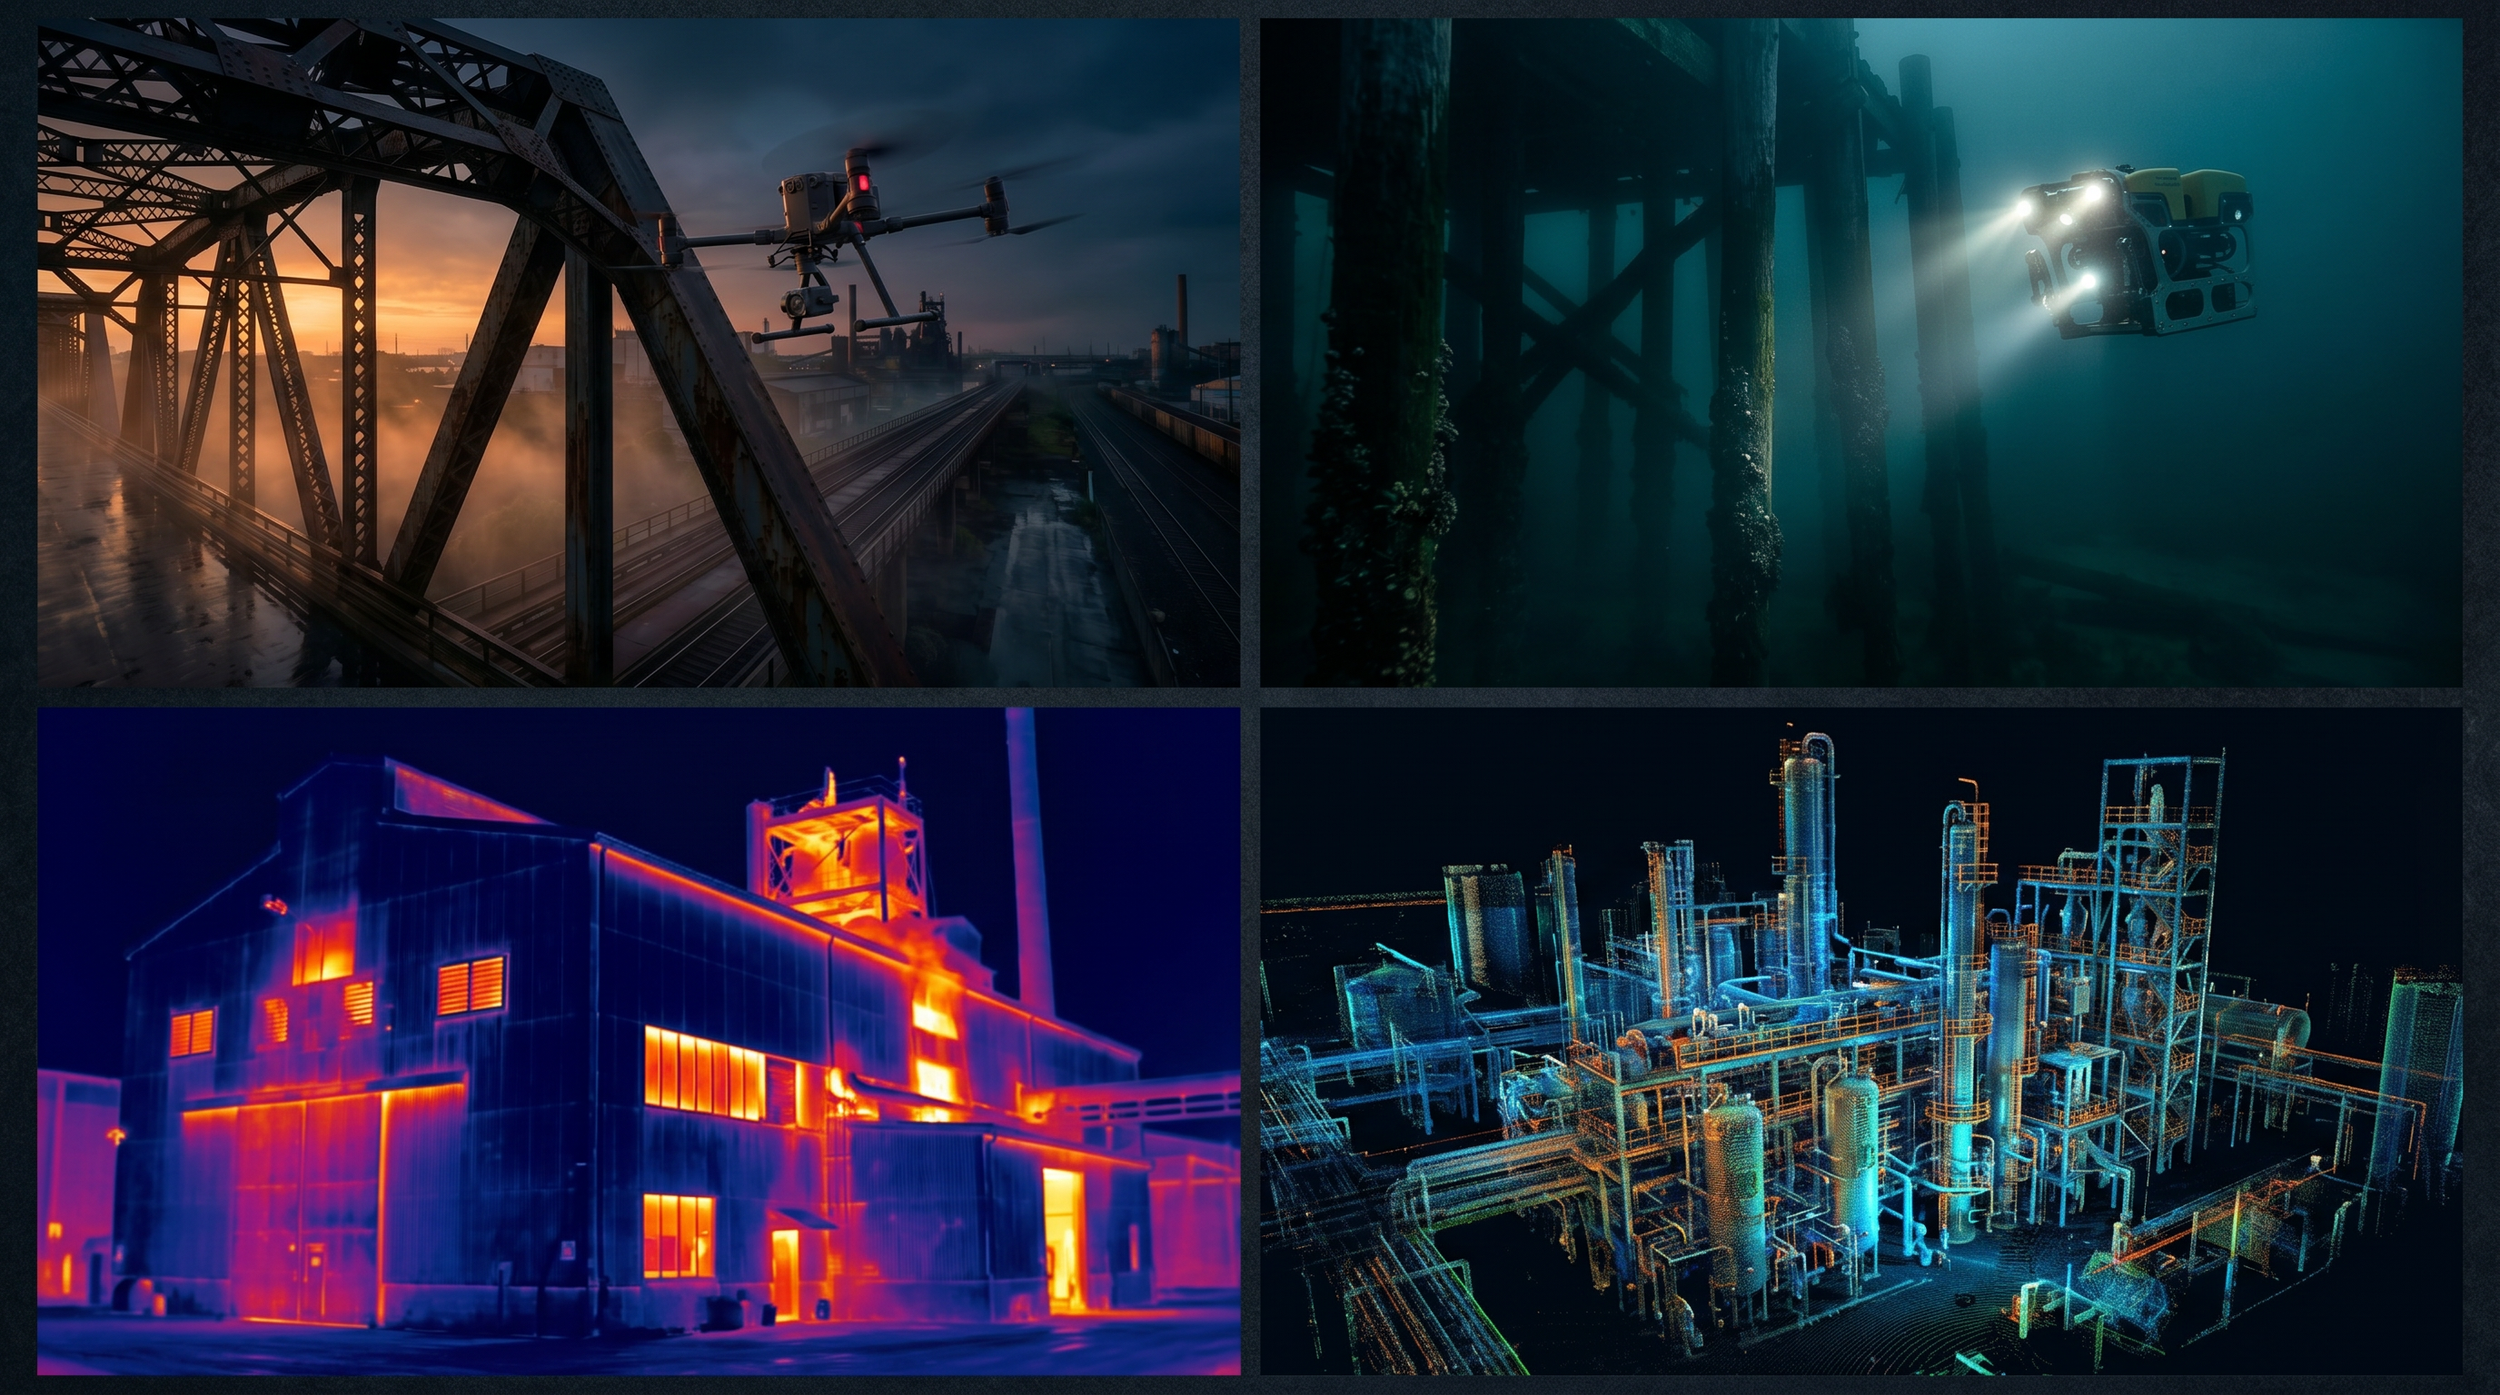
Council bridge substructure programs. Stormwater infrastructure. Recreational marine facilities. Environmental compliance monitoring. Emergency response (flood damage assessment). Council bridge portfolio models enable asset managers to prioritise maintenance spending based on measured condition data rather than subjective diver reports.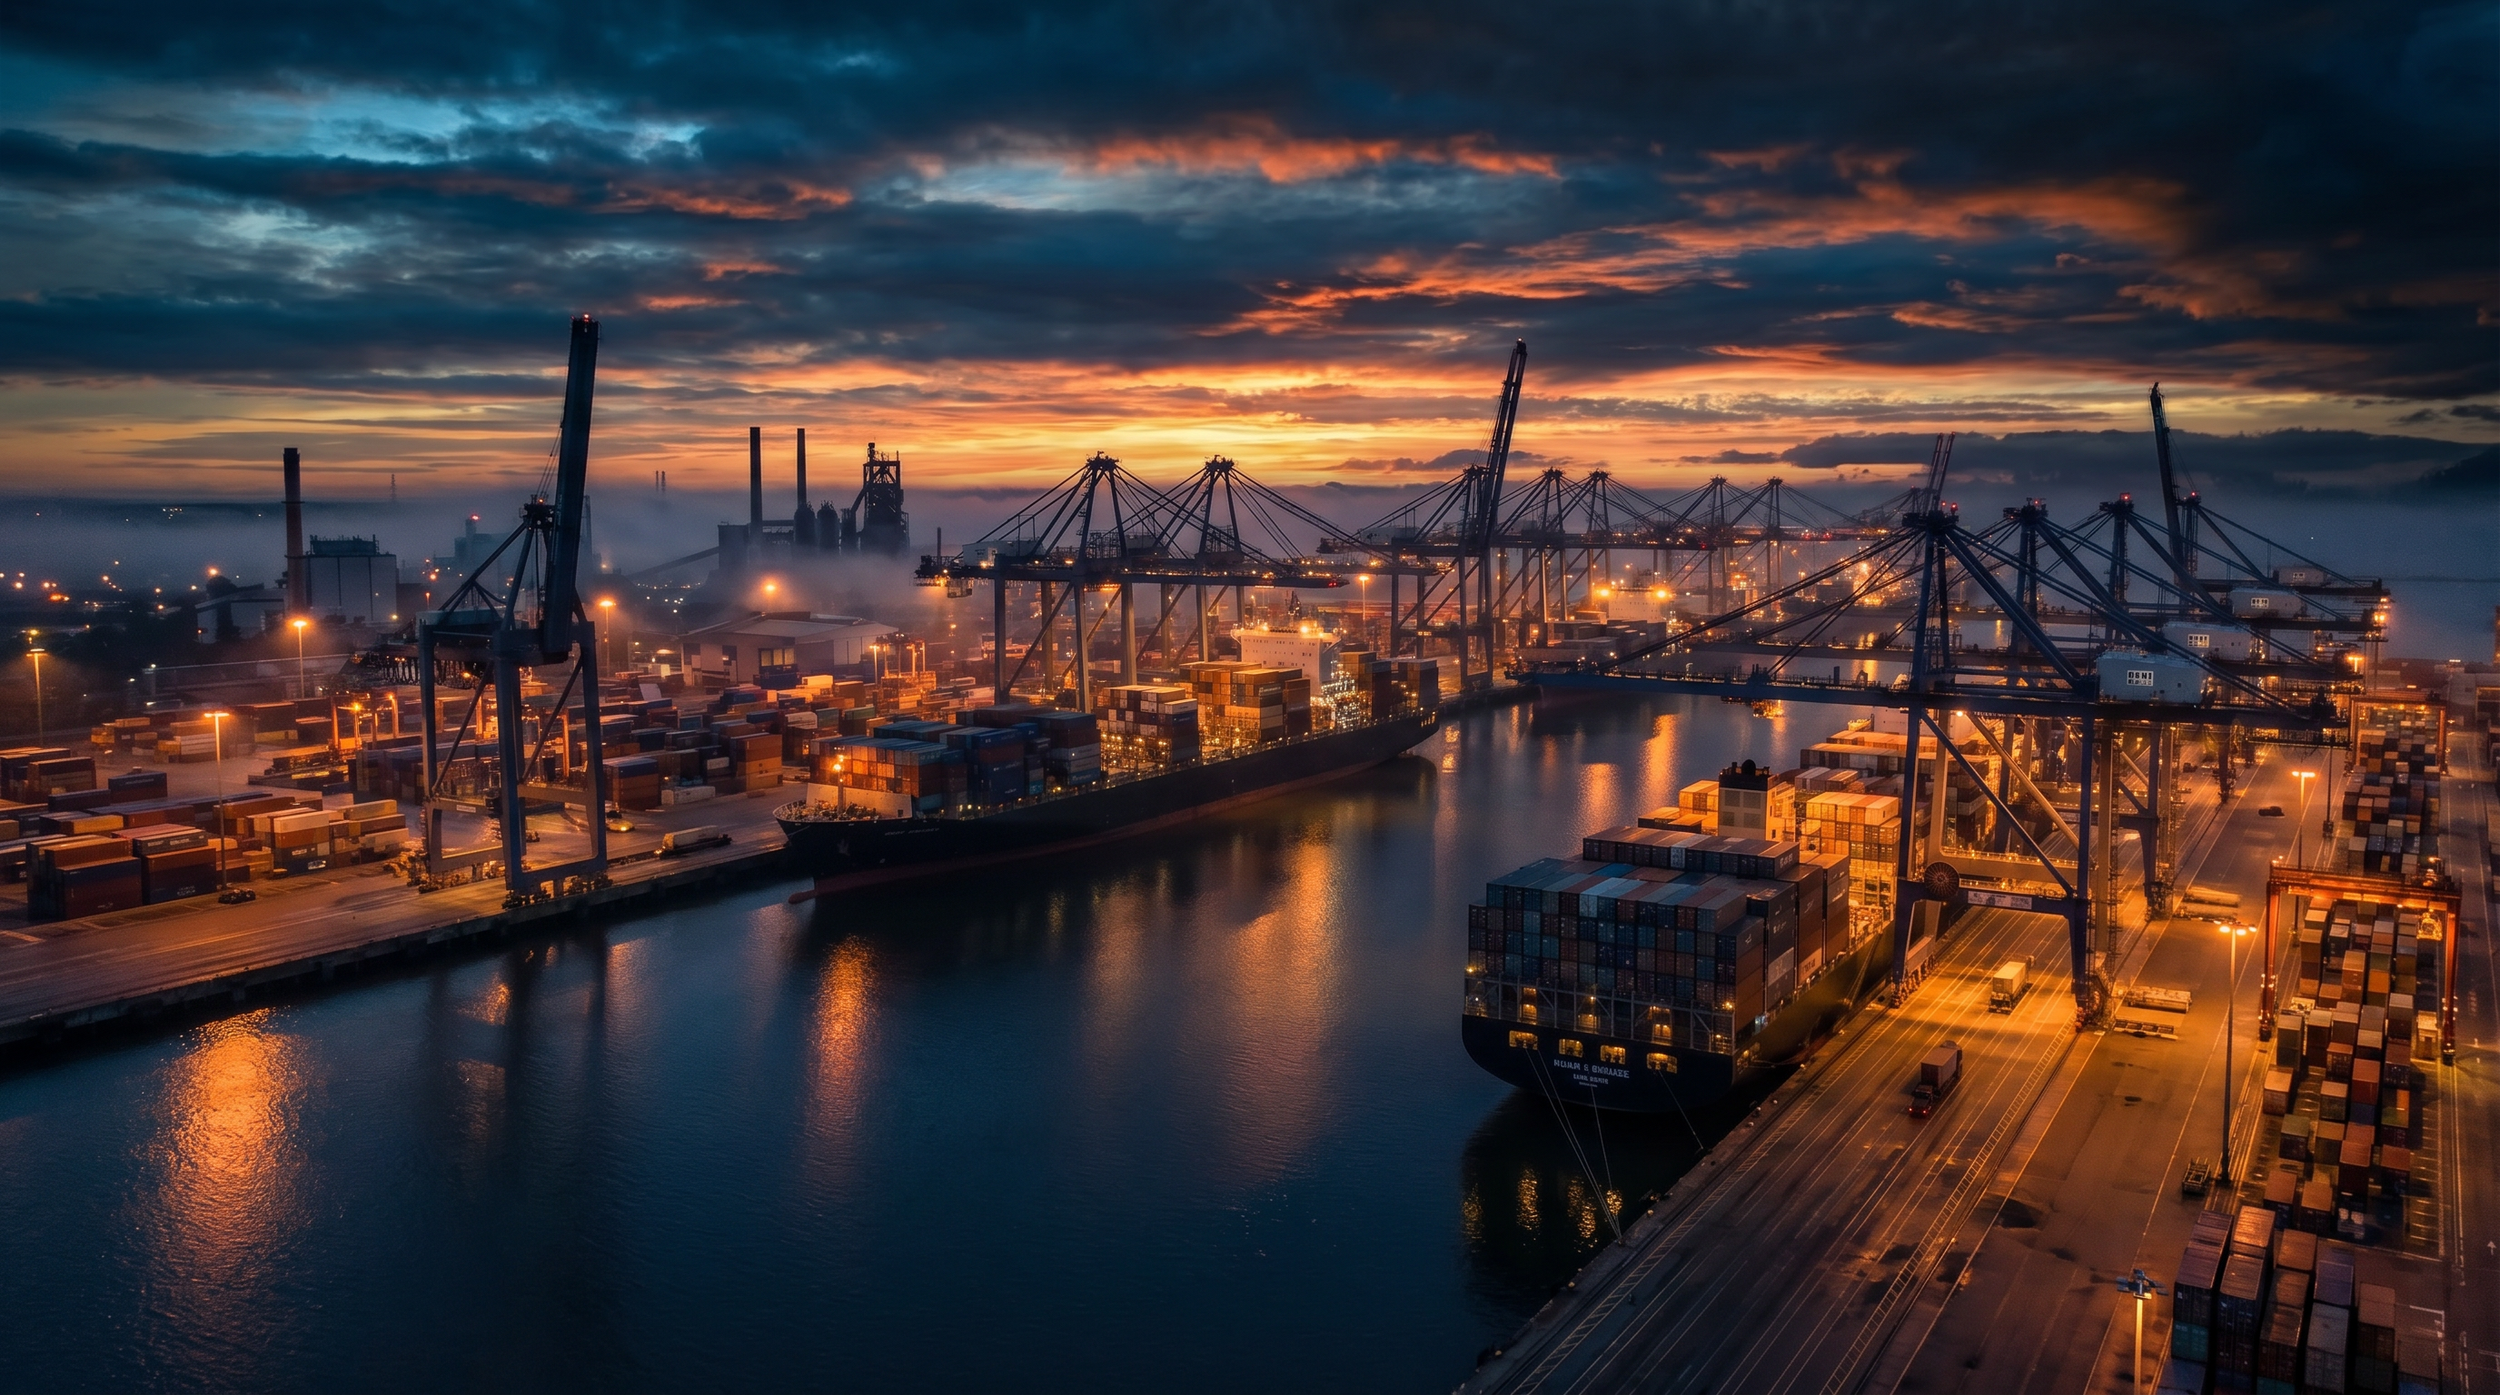
Wharf pile condition assessment. Jetty and berth structure inspection. Seawall and breakwater integrity. Pre/post-storm damage assessment. Compliance with AS 4997 Maritime Structures. Port asset models combine bathymetric, structural, and above-water data into a single digital twin. Track degradation across your entire marine portfolio from one platform.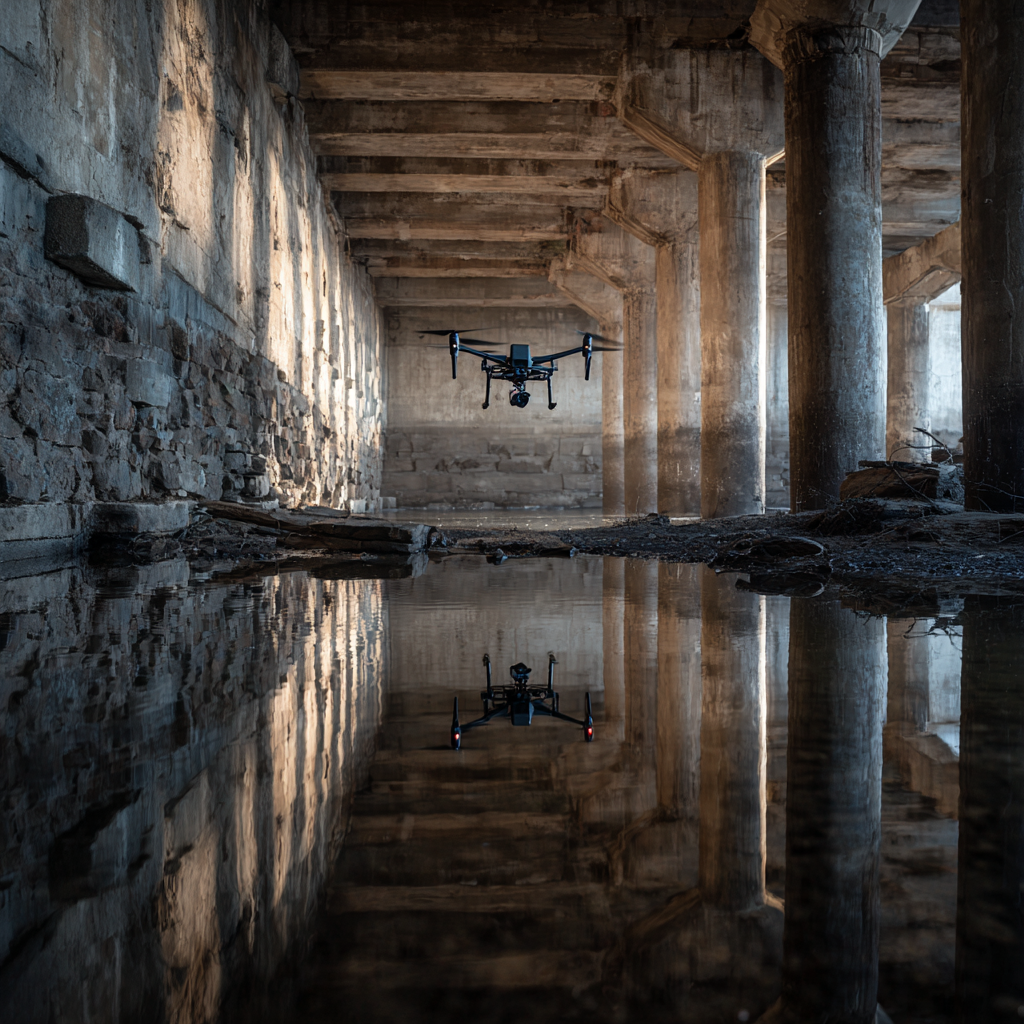
Dam wall and spillway inspection (ANCOLD compliance). Reservoir capacity measurement. Cooling water intake structures. Pipeline crossing and burial depth verification. Penstock and tunnel inspection. Dam and reservoir models include capacity calculations, structural condition, and spillway assessment in one interactive deliverable. Compare against design specifications directly.Frequently Asked Questions
How deep can your ROVs operate?
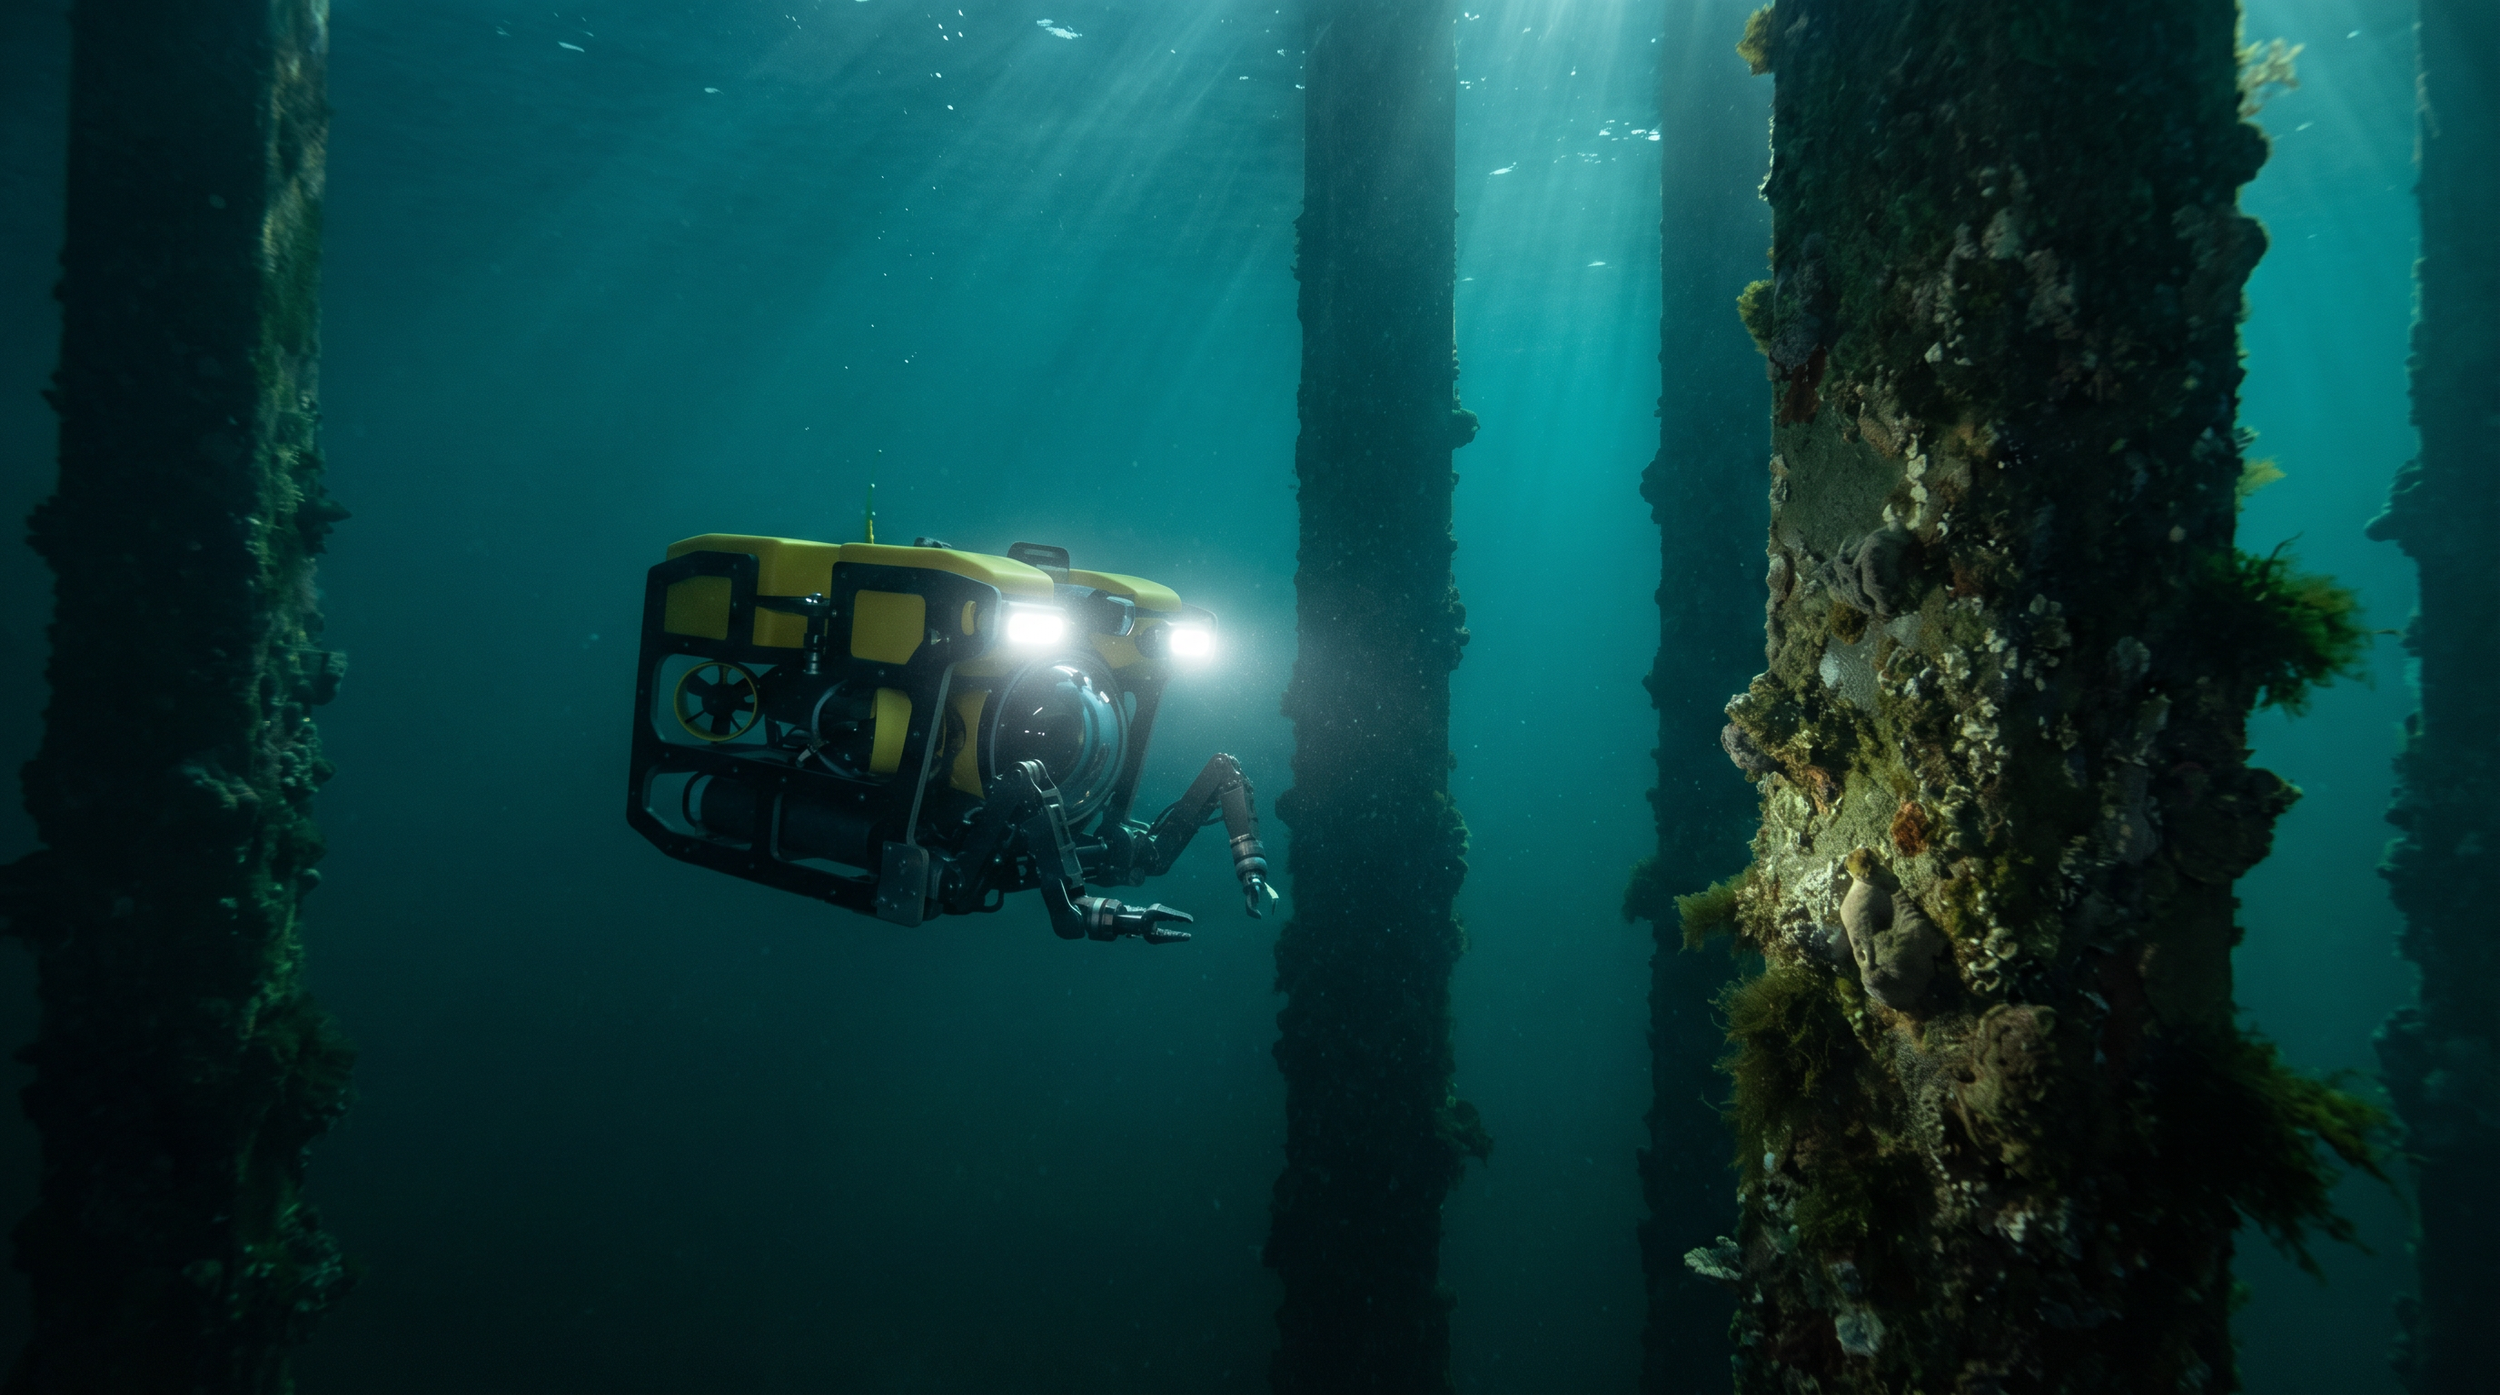
Our enterprise ROV fleet operates to depths of 500 metres, covering the vast majority of infrastructure inspection requirements including wharf piles, dam walls, intake structures, pipelines, outfalls, seawalls, and offshore jacket structures. The ROVs are equipped with 4K cameras, powerful LED lighting (30,000+ lumens), multibeam sonar, and manipulator arms for close inspection and measurement. For assets in turbid or zero-visibility conditions, sonar provides complete structural mapping regardless of water clarity.
How much does ROV inspection cost compared to commercial divers?
ROV inspection typically delivers 50-70% cost savings compared to commercial dive teams for equivalent asset coverage. Commercial dive operations require a minimum team of 4-6 personnel (divers, standby diver, supervisor, tender), hyperbaric equipment, medical support, and extensive WHS documentation. ROV operations require 2-3 personnel with significantly lower mobilisation costs, no weather standby charges for surface conditions, and no depth-related time limitations. The ROV can operate continuously for 8+ hours without fatigue or decompression requirements.
Can ROVs replace divers for all underwater inspections?
For visual inspection, condition assessment, and measurement tasks, ROVs replace divers in approximately 90% of scenarios. ROVs provide superior documentation (4K video, sonar mapping, photogrammetry), longer bottom time, greater depth capability, and zero personnel risk. Tasks that still require divers include physical intervention work (bolt torquing, anode replacement, marine growth removal) and some confined underwater spaces with complex access geometry. We assess each project individually and recommend the safest, most cost-effective approach.
What submerged assets can you inspect?
We inspect wharf piles (timber, steel, concrete), dam walls and spillways, pipeline crossings and outfalls, intake and outlet structures, seawalls and revetments, bridge piers and abutments, culvert inverts, stormwater infrastructure, ship hulls, mooring systems, jetty structures, and offshore jacket structures. Our ROVs also perform bathymetric surveys for sediment mapping, scour assessment, and capacity calculations. All underwater data integrates with aerial and ground data into a unified above-and-below-waterline digital twin.
How do you inspect in zero-visibility water conditions?
In turbid or zero-visibility conditions, our ROVs switch from optical cameras to multibeam sonar, which provides complete structural mapping regardless of water clarity. Sonar creates detailed 3D point clouds of submerged structures, identifying deformation, missing members, marine growth thickness, and scour profiles. In partial visibility, we combine sonar with close-range LED-illuminated video for comprehensive documentation. This means inspections proceed regardless of weather, tidal conditions, or water quality.
Can you combine aerial drone and underwater ROV inspection in a single mobilisation?
Yes. This is our core differentiator. We deploy aerial drones (above-waterline structures, decks, approaches) and underwater ROVs (piles, seabed, submerged components) in a single mobilisation, eliminating the need to coordinate separate providers with different schedules, standards, and data formats. All data is processed into a single unified digital twin that provides complete above-and-below-waterline asset intelligence. One provider, one mobilisation, one integrated deliverable.
What deliverables do we receive from an underwater inspection?
Standard deliverables include 4K inspection video with depth and position overlay, high-resolution still imagery, multibeam sonar point clouds, bathymetric survey data, marine growth assessment, cathodic protection readings (where applicable), and a structured condition report with defect classification and severity ratings. For repeat inspections, automated change detection identifies deterioration between survey cycles. All data is georeferenced and accessible via our browser-based 3D platform without software installation.
How often should submerged assets be inspected?
Inspection frequency depends on asset type, material, environmental exposure, and regulatory requirements. Timber wharf piles in marine environments typically require annual inspection due to marine borer activity. Steel structures in seawater require 2-3 year cycles for corrosion monitoring. Concrete structures in freshwater may operate on 3-5 year cycles. Dam safety regulations typically mandate annual visual inspection with detailed engineering inspection every 5 years. We work with you to define the optimal cycle based on your specific risk profile and compliance obligations.
See What Risk Sits Below the Surface.
From bridge footings to dam walls, port infrastructure to ship hulls. We deploy ROV systems that deliver 4K video, AI-powered measurements, and 3D digital twins, without a single diver in the water.