

Environmental Drone & ROV Monitoring, Mapping, Tracking & Conservation Intelligence
INTELLIGENCE - DETECTION - TREATMENT - COMPLIANCE
Objective & Repeatable Data: EPBC Act Compliance, Rehabilitation Bond Release, and Conservation Programs.
Complete site coverage. Zero ground disturbance. Complete Visability
Move Beyond Manual Transects
ISO 9001, 14001, 45001 Aligned
|
Local Buy: Pre-Qualified
|
Qld DESTI Approved Suitable Operator
|
CASA ReOC
|
$20m Public Liability Insurance
|
Aerial & Ground Distribution Licence
|
ISO 9001, 14001, 45001 Aligned | Local Buy: Pre-Qualified | Qld DESTI Approved Suitable Operator | CASA ReOC | $20m Public Liability Insurance | Aerial & Ground Distribution Licence |
The Compliance Landscape Has Changed
Are the methods you are using today adequate for the enhanced enforcement?
$55M
Alcoa fined for illegally clearing 2,100 hectares (Feb 2026) [2]
$825M
Proposed maximum civil penalty under EPBC Act reforms [5]
1 in 7
EPBC Act approvals non-compliant with offset conditions (2024 audit) [1]
$520M
McArthur River Mine rehabilitation bond [3]
The Challenges
The Visibility Problem:
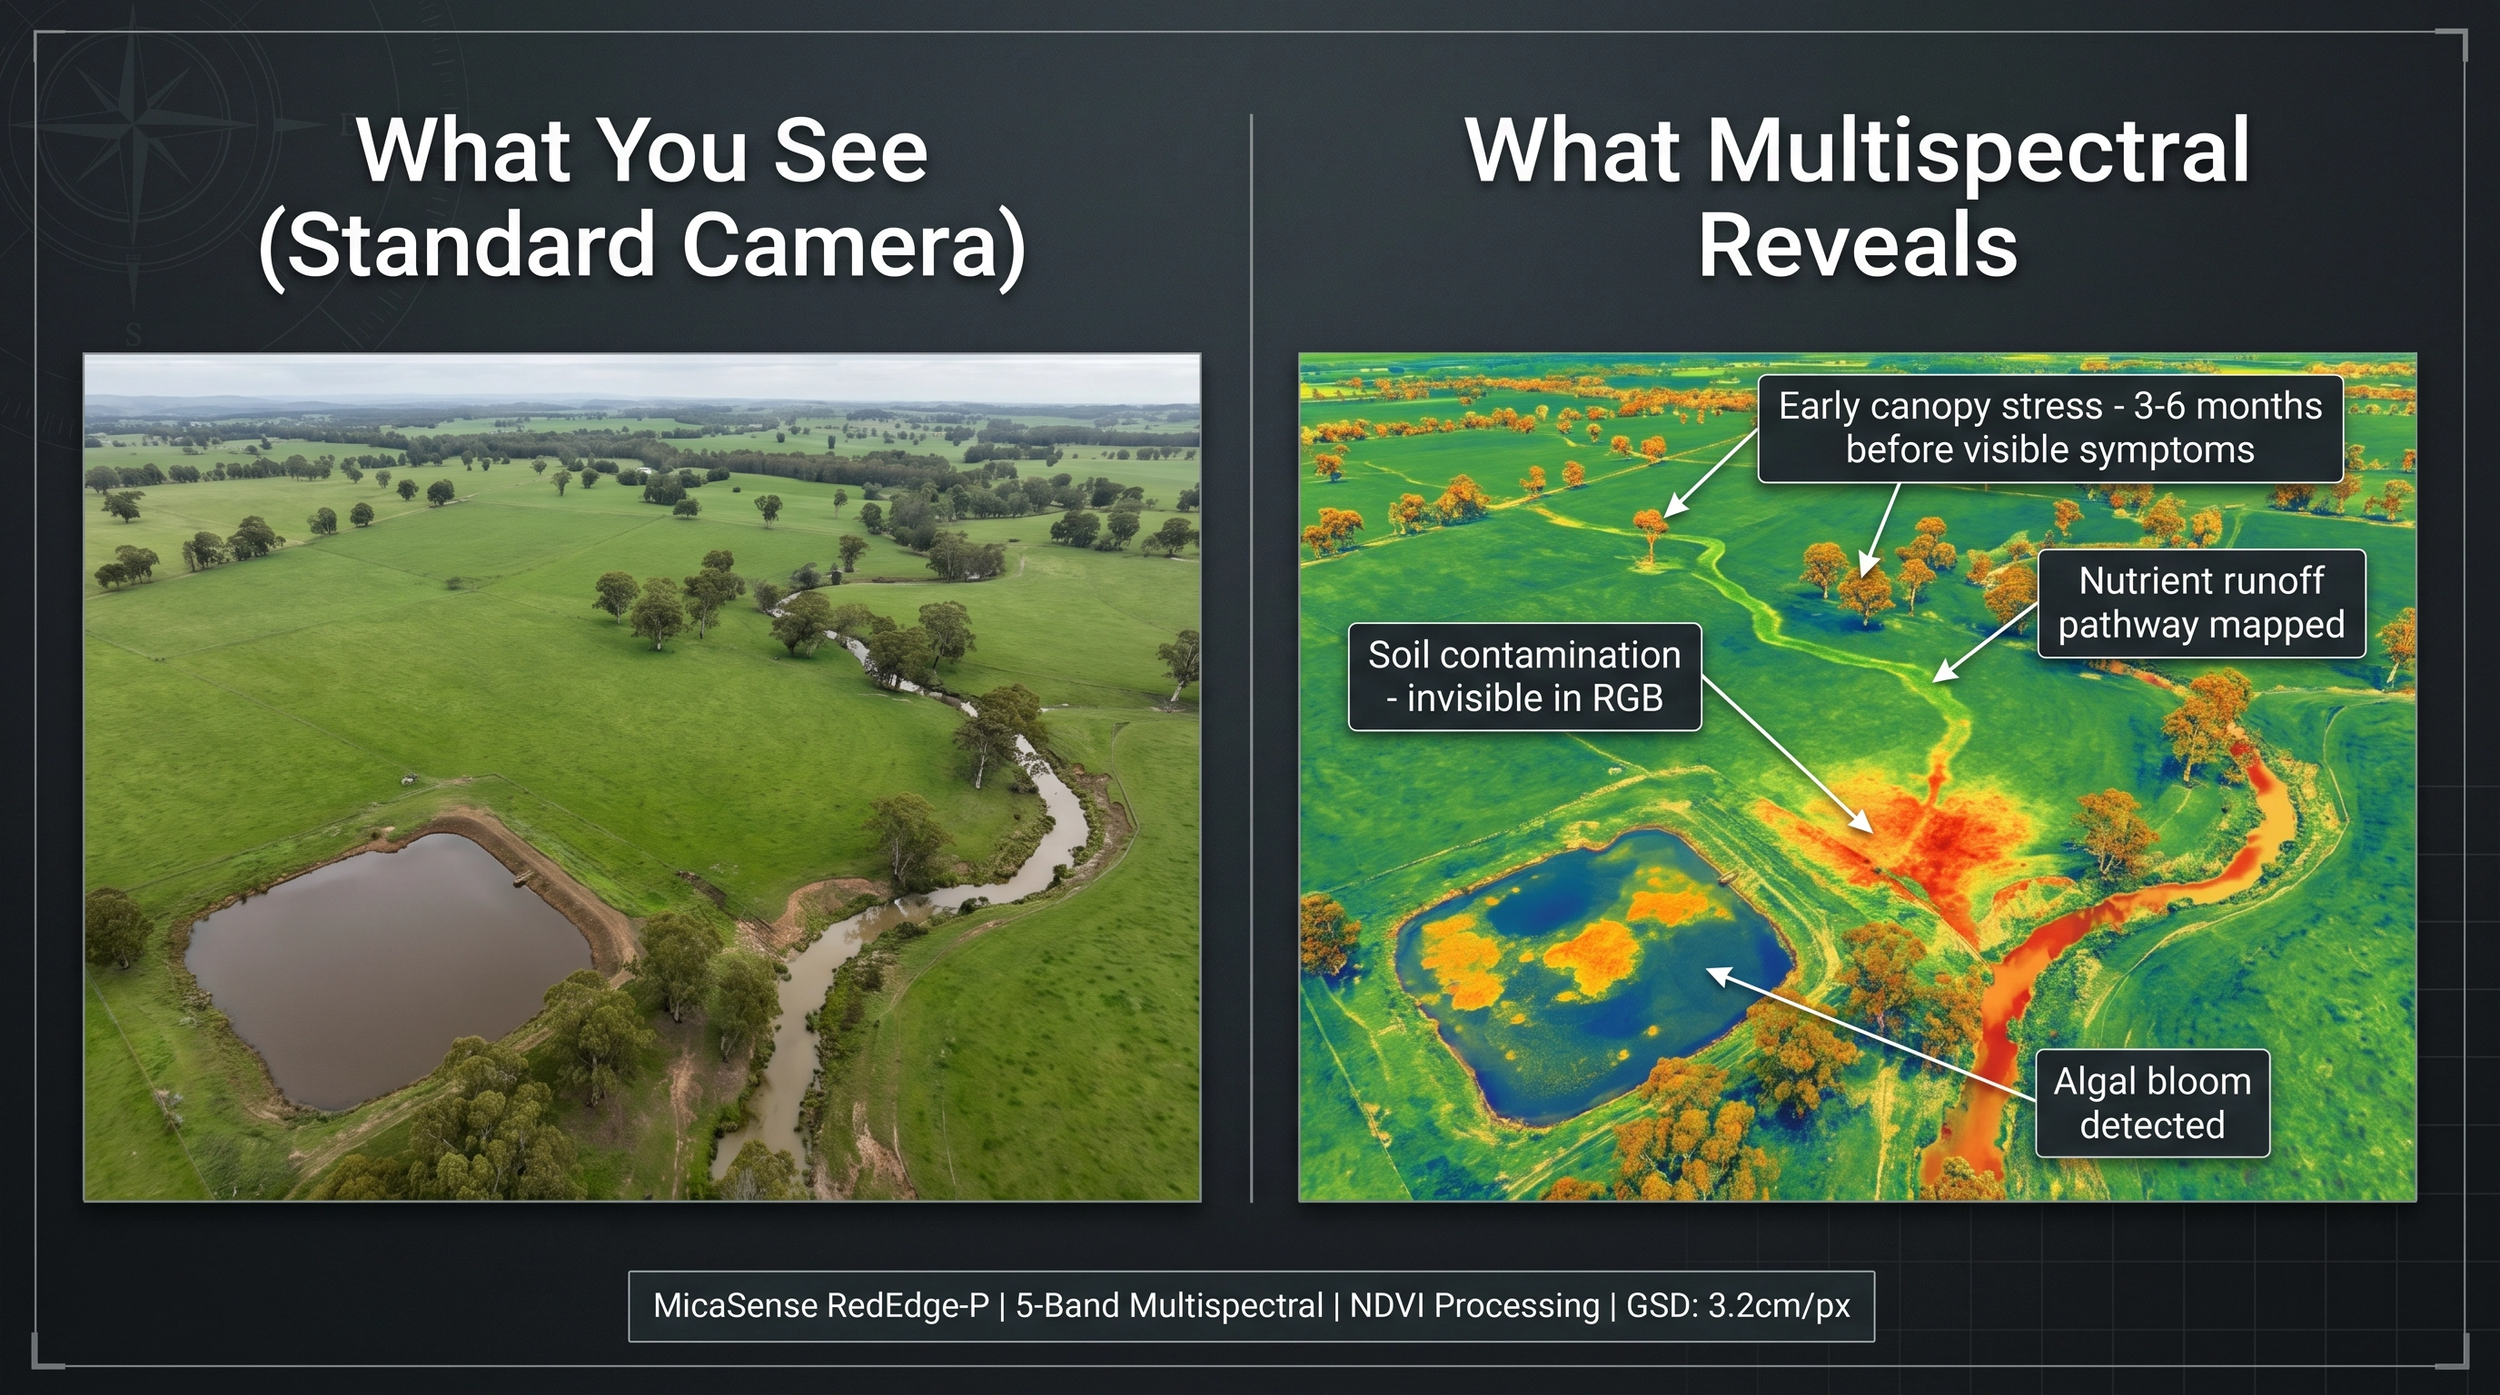
You cannot detect early signs of vegetation stress, disease, or subtle changes in soil health with standard visual inspections.
By the time your field team identifies the issue, the damage is already severe.
The Subjectivity Problem:
Two ecologists walking the same transect will record different observations.
Your year-on-year comparisons rely on consistency that manual methods simply cannot deliver.
The Fragmentation Problem:
Separate providers for aerial, ground ecology, water quality, and fauna deliver incompatible data formats on different timelines.
No single view of environmental conditions. No spatial correlation between datasets. No way to track how one factor influences another.
The Scale Problem:
Your field teams spend weeks walking transects that capture only 5-15% of the total site.
Extrapolating this data across hundreds of hectares leaves significant gaps.
Why does this matter?
When detection and treatment are split across providers, the gap between "identified" and "treated" is where compliance failures occur. A closed-loop methodology eliminates that gap, the same spatial intelligence that finds the problem, guides the treatment and proves the outcome.
“Comprehensive, reliable, and professional”
The Request:
Multisite 3D digital twin with ground 360 imaging and exterior visual and thermal overlays. Remote browser access for overseas specialist engineers to measure, detect, and tag, while the site remained fully operational.
The Result:
A 3D digital twin, remote browser access, the ability to take measurements, detect concerns and geotag them with notes, plus a radiometric thermal overlay and complete ground level 36 walk through.”
DeepSky IQ: A Living Environmental Digital Twin
Every data acquisition builds a measurable, 3D environmental model. Not just a PDF report that sits in a drawer. A digital twin where your team and regulators can compare any two dates, measure vegetation health and growth at the individual plant level, and track compliance trajectory in real time, remotely. Less time spent on compliance activities, streamlined communications, and increased stakeholder trust.
The technology captures the data. The platform turns it into intelligence.
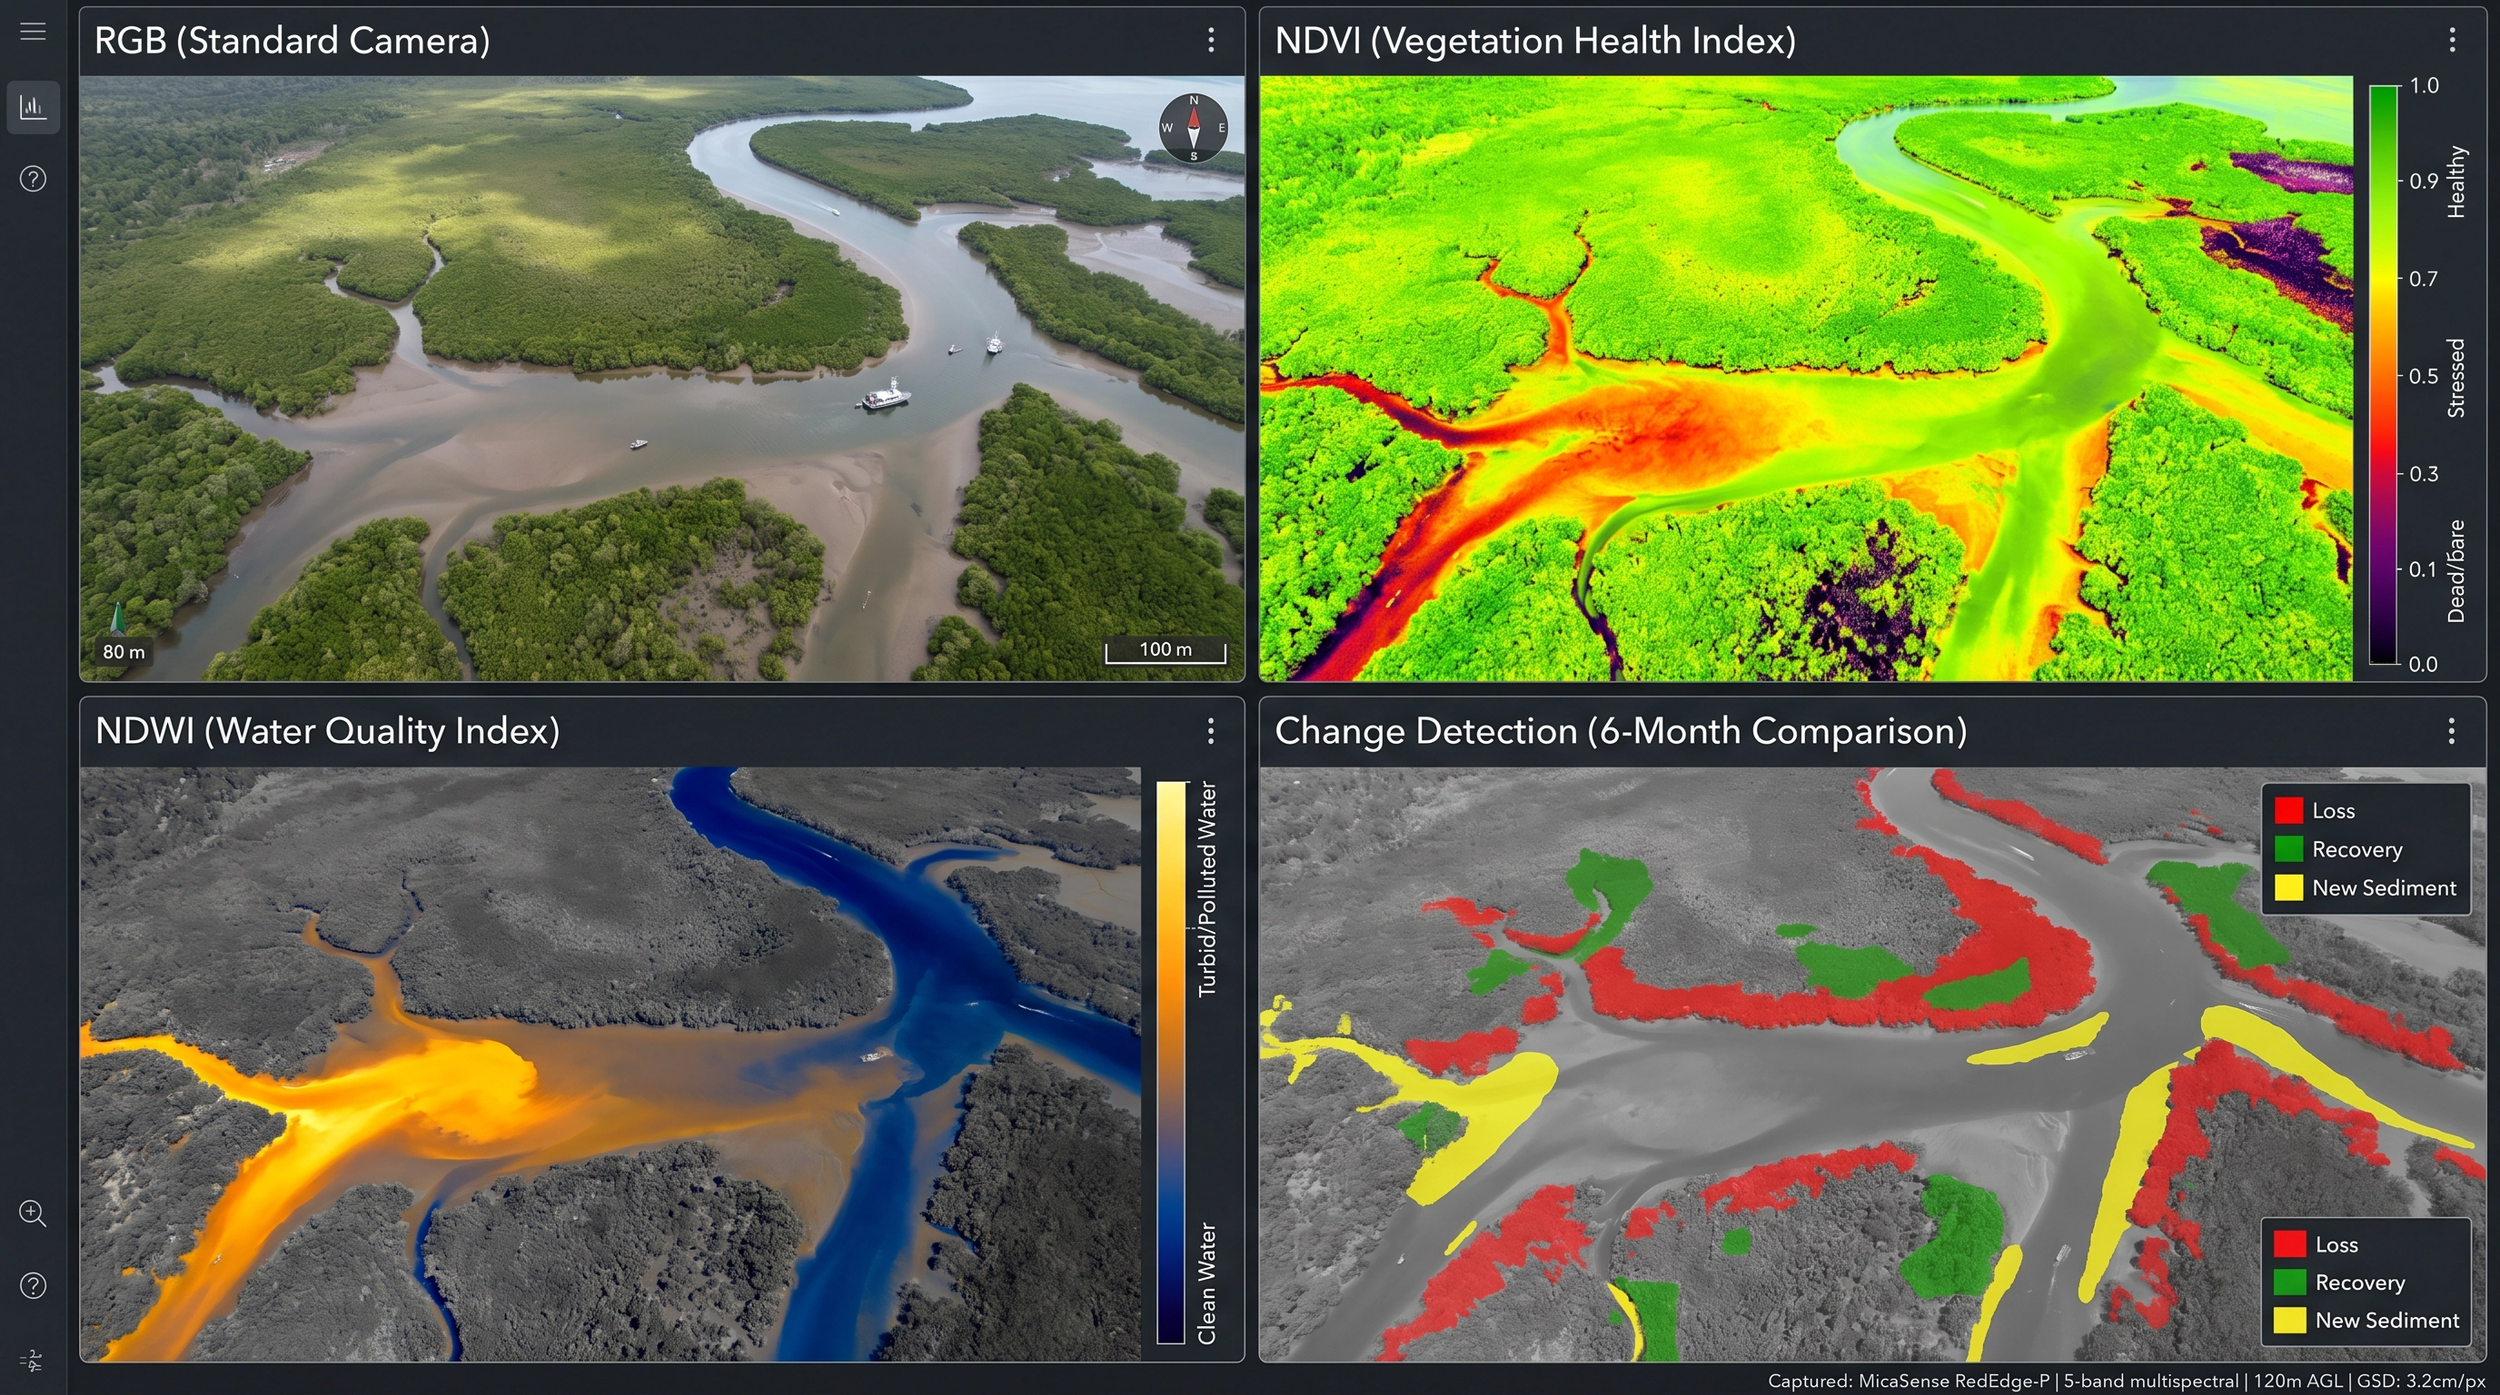
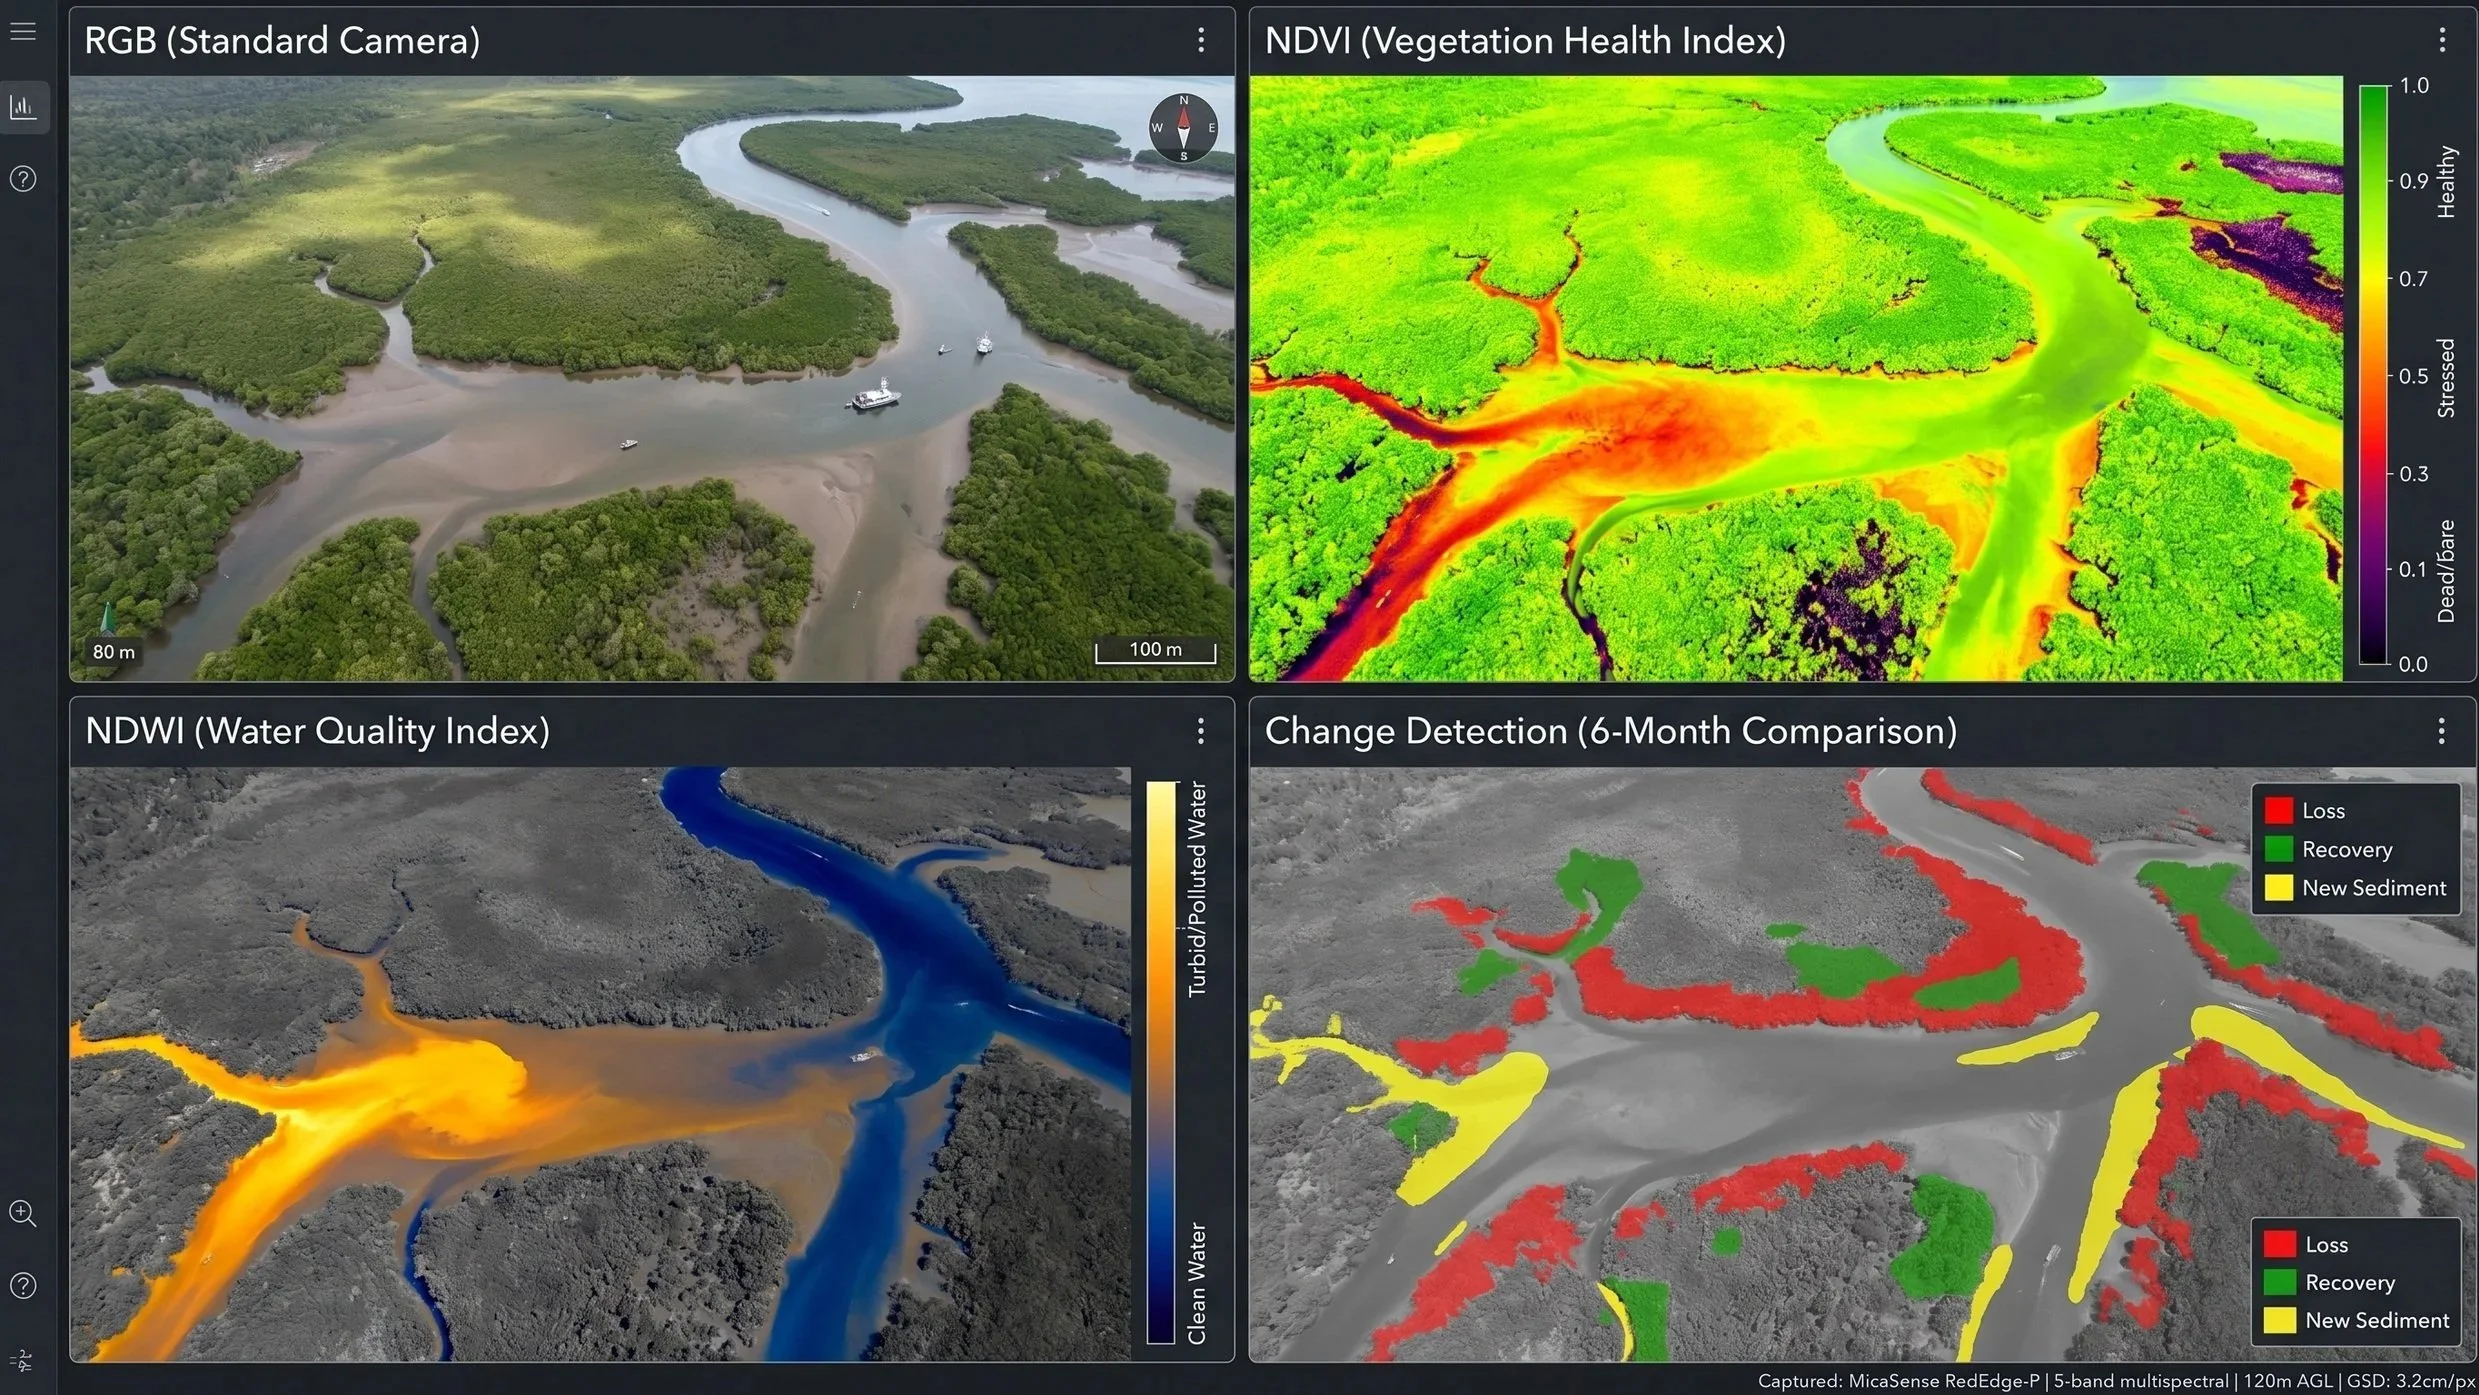
We deploy multispectral, thermal, visual and LiDAR sensors alongside underwater ROVs to capture the true state of your environment, from canopy top to bare earth to below the waterline. All data is processed through our enterprise reality modelling platform, generating centimetre-accurate 3D terrain models, NDVI vegetation health maps, and automated temporal change detection. Your environmental digital twin is accessible via a browser-based 3D viewer; interactive models are viewable in any web browser by any stakeholder at any time.
As data accumulates, the model becomes predictive, identifying areas trending toward non-compliance before they breach thresholds and quantifying rehabilitation trajectories for bond-release applications.
Monitoring Capabilities
Vegetation & Land Health
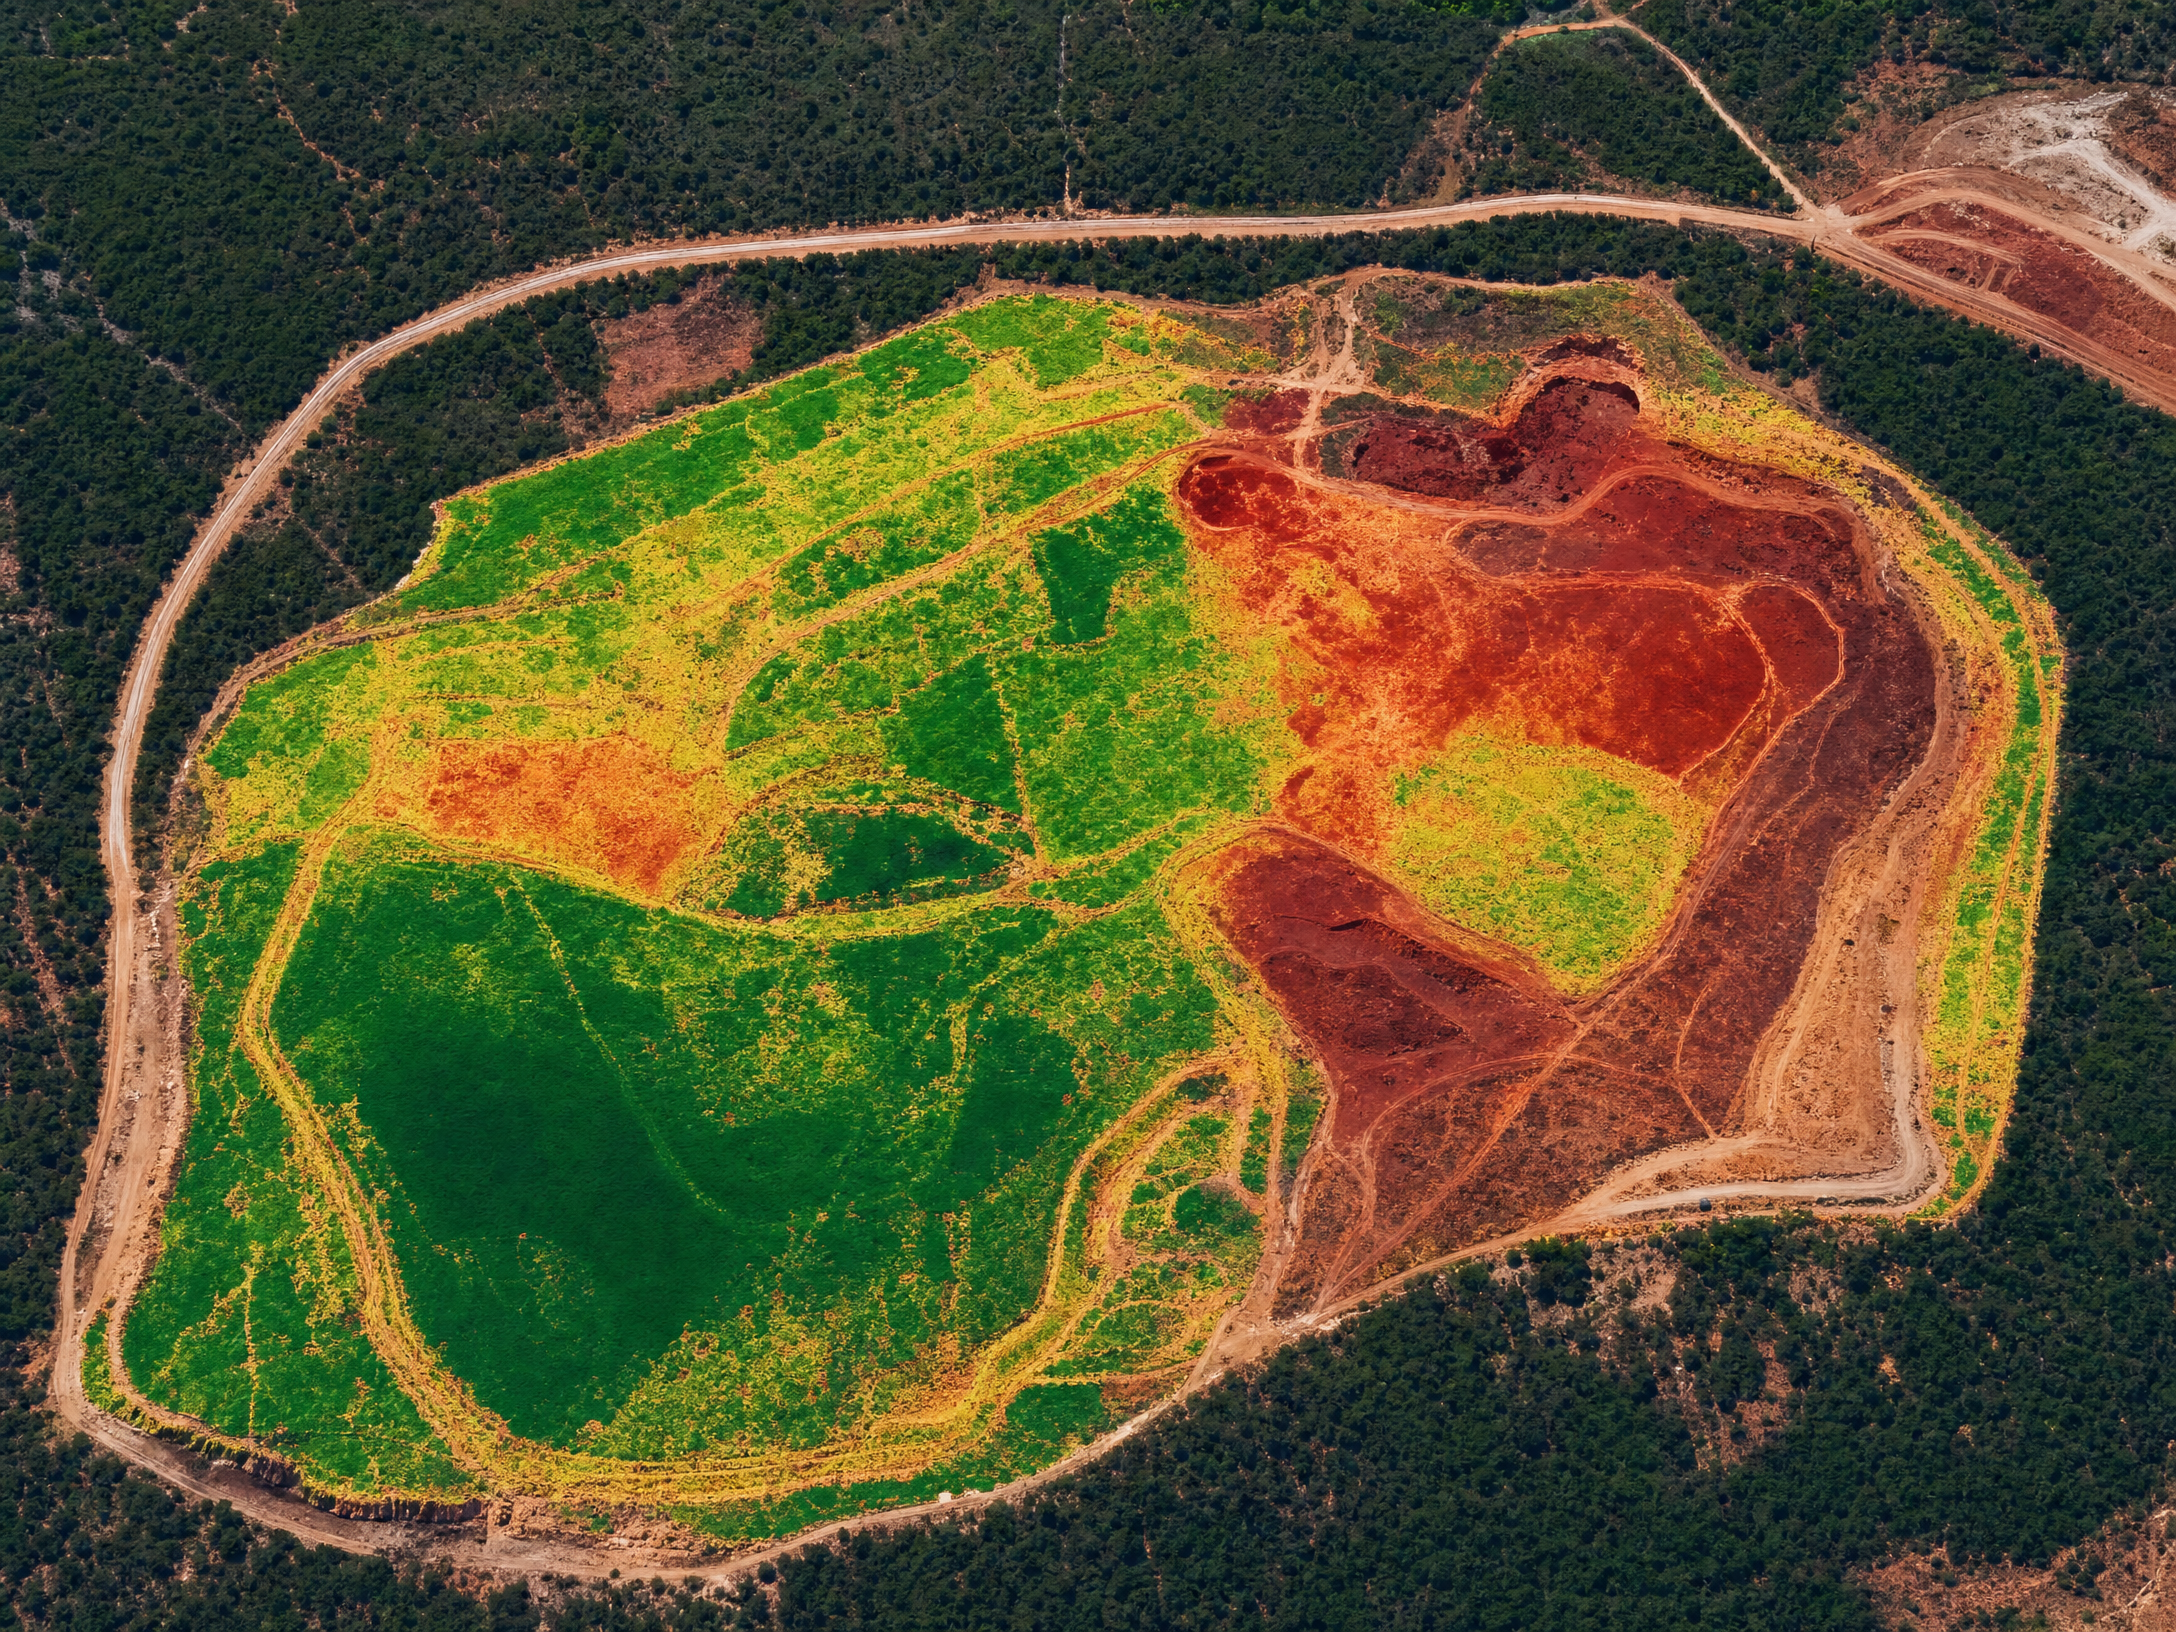
NDVI multispectral mapping: 2 - 5 cm GSD, 60 - 500x better than satellite resolution.
LiDAR canopy penetration: Maps true ground surface beneath dense vegetation.
High-resolution orthomosaics: Objective visual baseline, year-on-year comparison.
Weed, disease, and pest detection: Early AI and ML supported identification & management before it is visible to the naked eye.
Erosion volumetrics: Centimetre-precise soil loss measurement between epochs.
Time-series 3D terrain models track volumetric erosion, vegetation growth, and soil movement with centimetre precision. Compare any two survey dates instantly in your environmental digital twin.
Marine & Coastal:
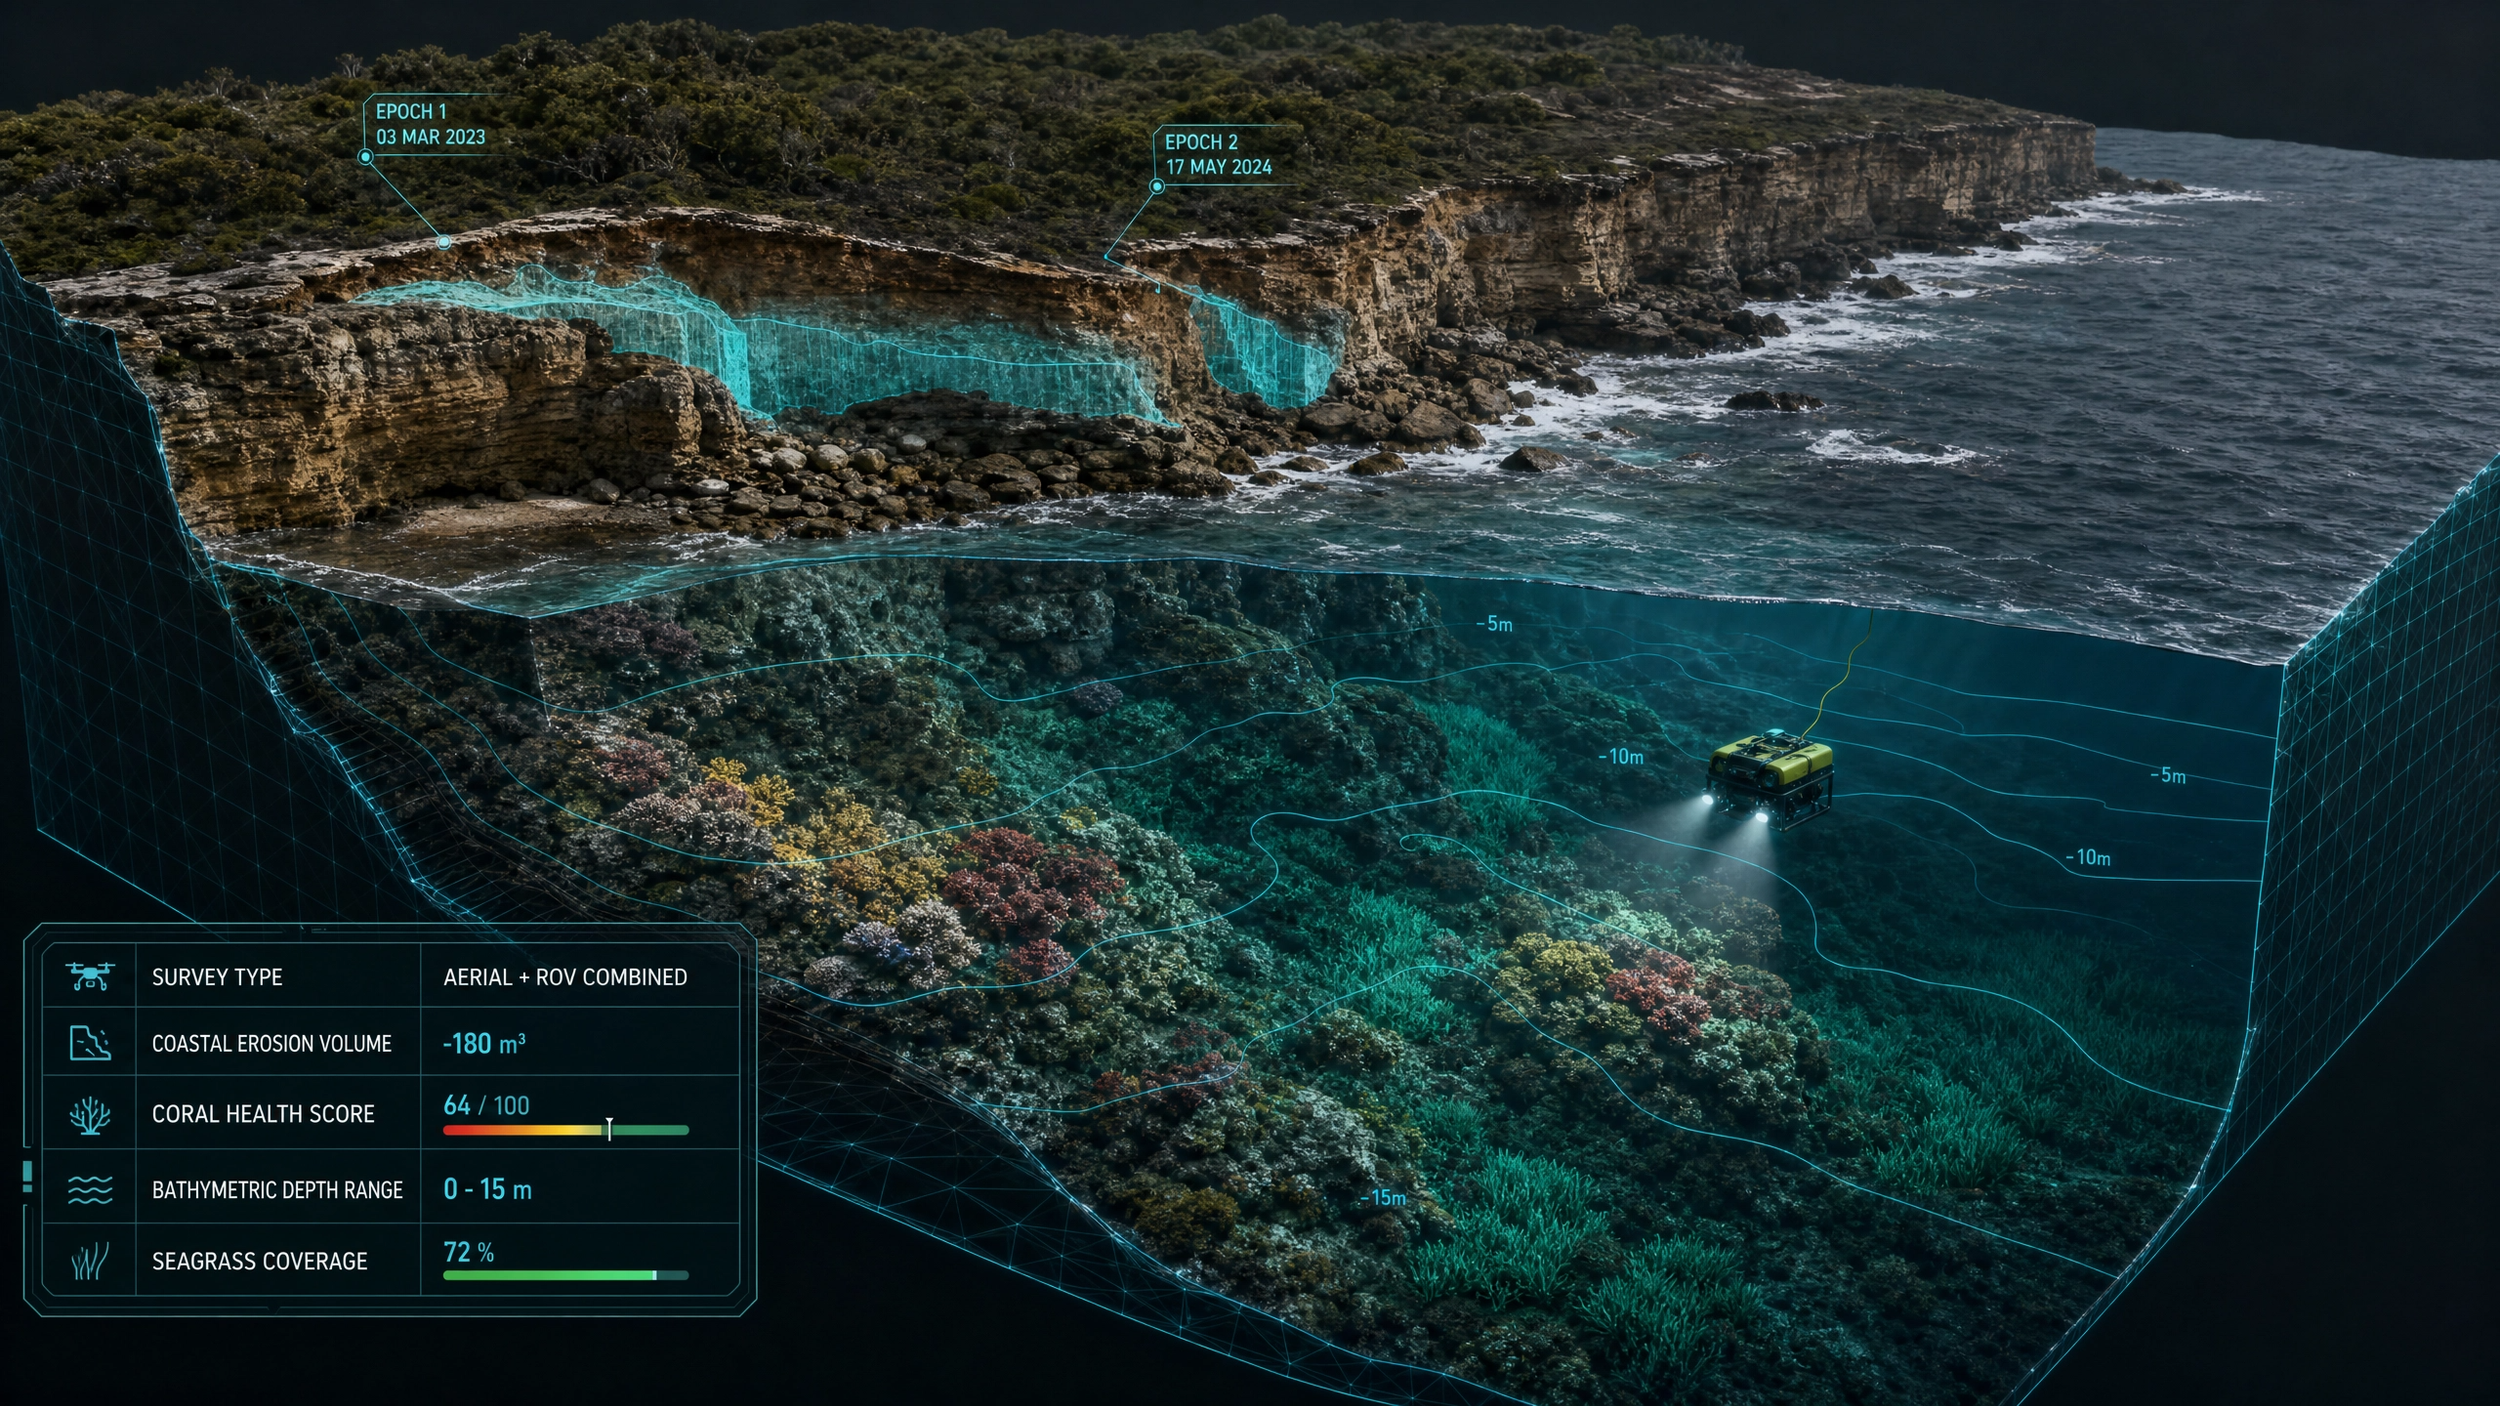
Aerial + ROV combined surveys: Above and below waterline in a single mobilisation.
Coral reef health assessment: Seagrass mapping, bleaching detection..
Coastal erosion volumetric tracking: Precise comparison measurements between any two dates.
Marine mammal population surveys: Accurate counting with thermal detection.
Bathymetric mapping: Depth contours, capacity estimates, sediment tracking.
Unified above and below the waterline 3D models, combining aerial photogrammetry with ROV data. Track coastal erosion and marine habitat condition in one interactive model, no separate providers, no incompatible datasets.
Wildlife & Species
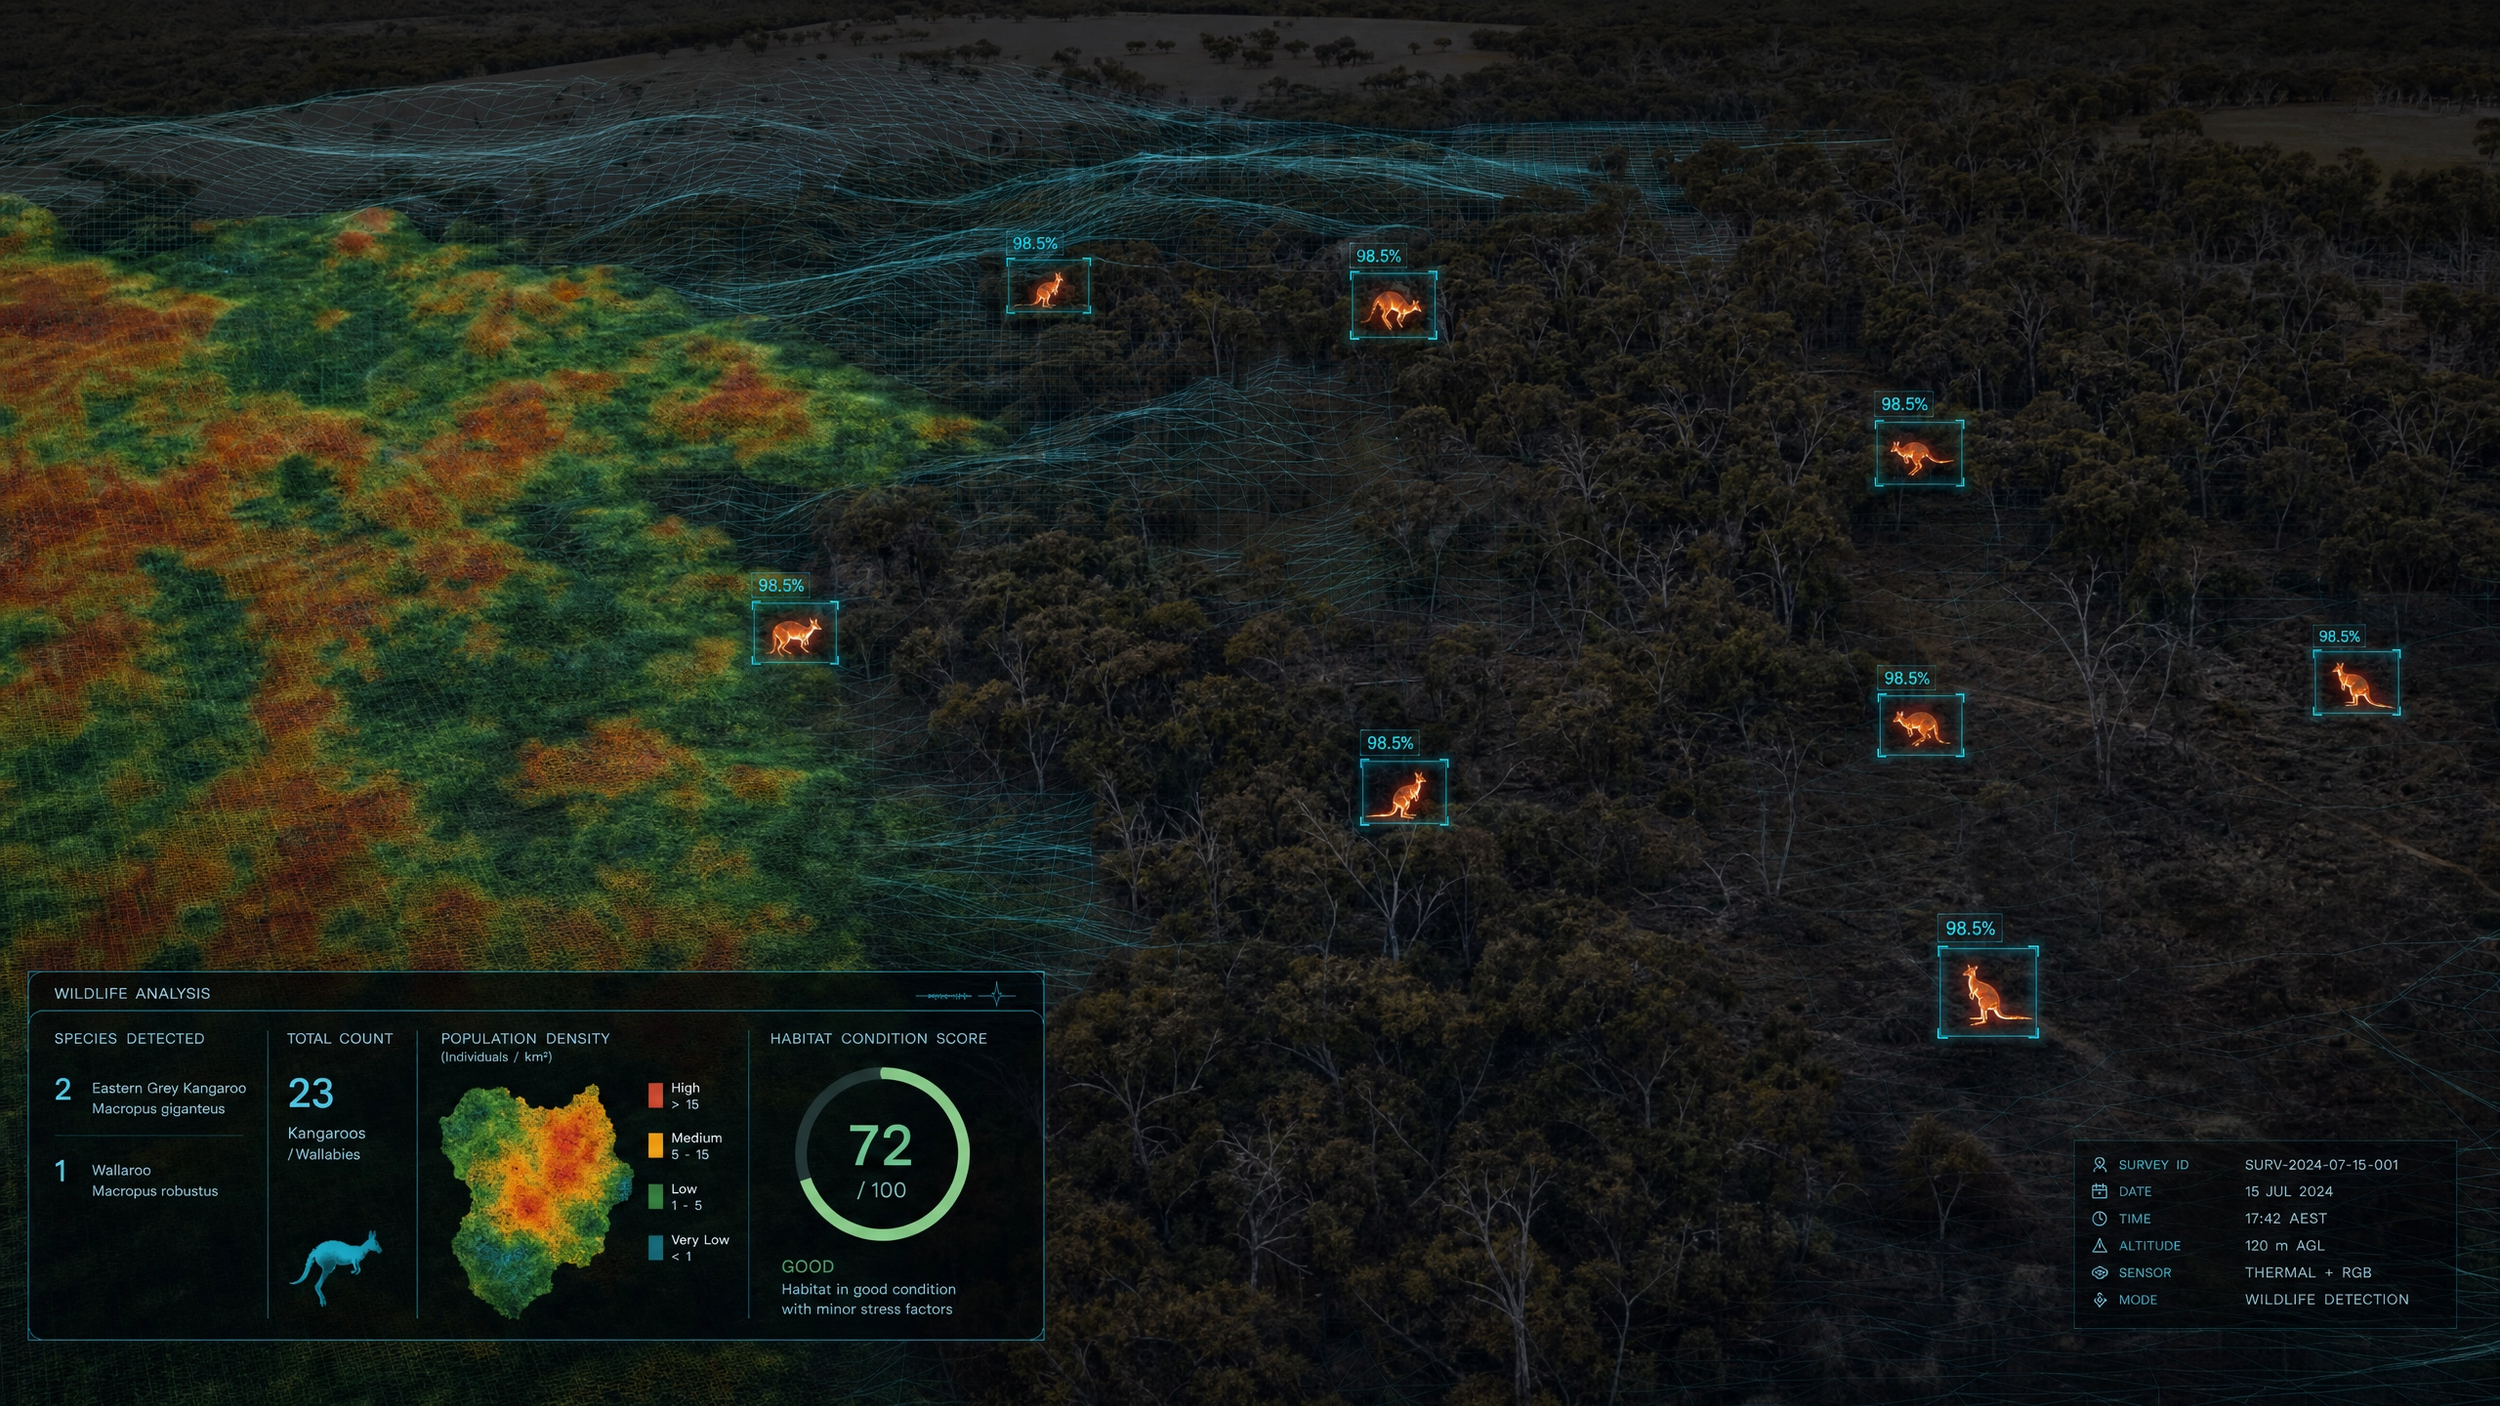
Thermal wildlife surveys: Nocturnal, dense vegetation, nesting sites detected without disturbance.
AI-powered species detection and counting: 98.5% accuracy, consistent across all surveys..
Non-invasive population tracking: Repeatable flight paths, zero disturbance.
Migration pattern monitoring: Breeding colony assessment, over multiple seasons.
Habitat condition correlation: Population data overlaid on vegetation health maps.
Georeferenced wildlife detection data overlaid on 3D habitat models. When tracking changes in population density over time against habitat conditions, the correlation between vegetation health and species presence becomes measurable.
Rehabilitation & Compliance
EPBC Act offset monitoring: Repeatable, defensible data across 100% of offset area.
Mining rehabilitation progress tracking:
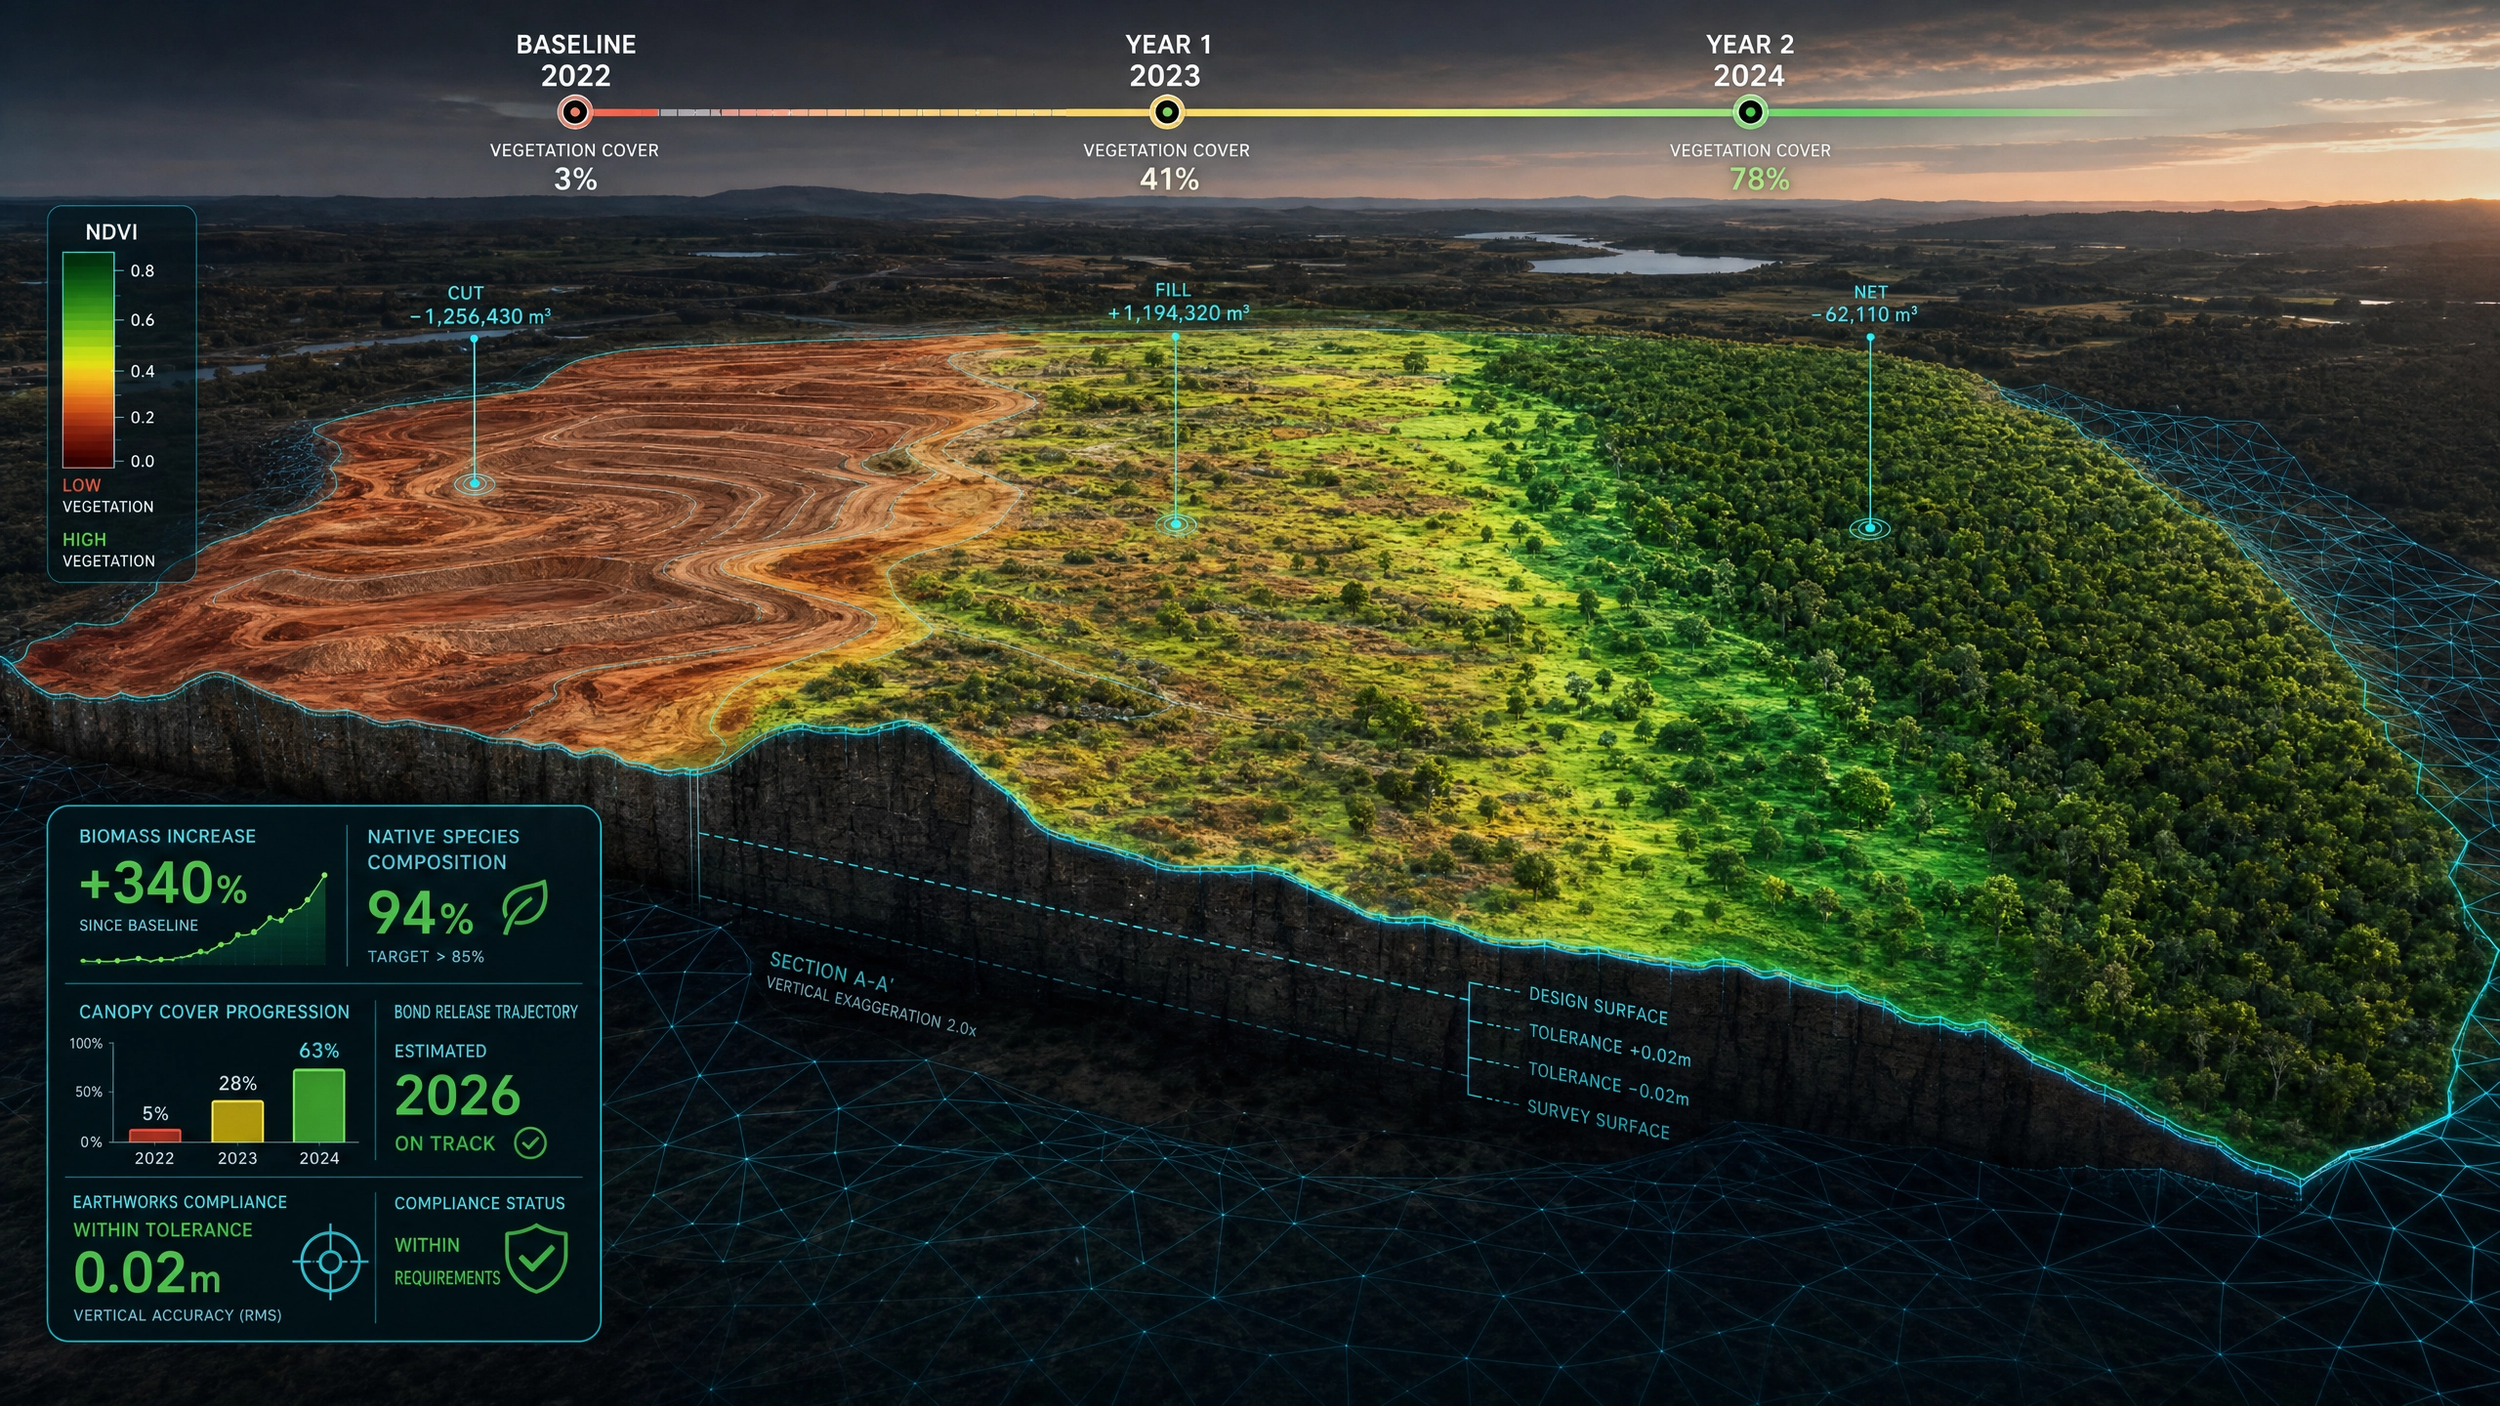
Quantified evidence for bond release.
Bushfire recovery monitoring: dNBR burn severity, regeneration tracking at the individual tree level.
Erosion and sediment control reporting: Accurate Volumetric measurement, not a visual estimate.
Volumetric earthworks tracking:
Precise Cut/fill calculations with centimetre accuracy.
Engineering-grade rehabilitation models demonstrate measurable progress to regulators. Volumetric calculations prove earthworks compliance. Time-series comparison shows vegetation recovery trajectory, not "it looks green" but "biomass has increased 340% since baseline with 94% native species composition."
Data Capture Performance
10-20x
Greater coverage vs ground observers
1400ha
Covered in 1 day vs 3 weeks manual
2-5cm
60 - 500x more detail than satellite
100%
Site coverage vs 5-15% from transects
Calculate Your Savings
Provider Consolidation Opportunity: By integrating detection and treatment under one closed-loop contract, you eliminate the gap between "identified" and "treated" — where compliance failures occur — while reducing duplicated mobilisation costs by 30-40%.
or call 0492 449 655
Industry Specific Environmental Intelligence
Mining & Resources
EPBC Act offset monitoring and compliance reporting.
Rehabilitation progress tracking for bond release.
Tailings storage facility vegetation monitoring.
Dust suppression effectiveness assessment.
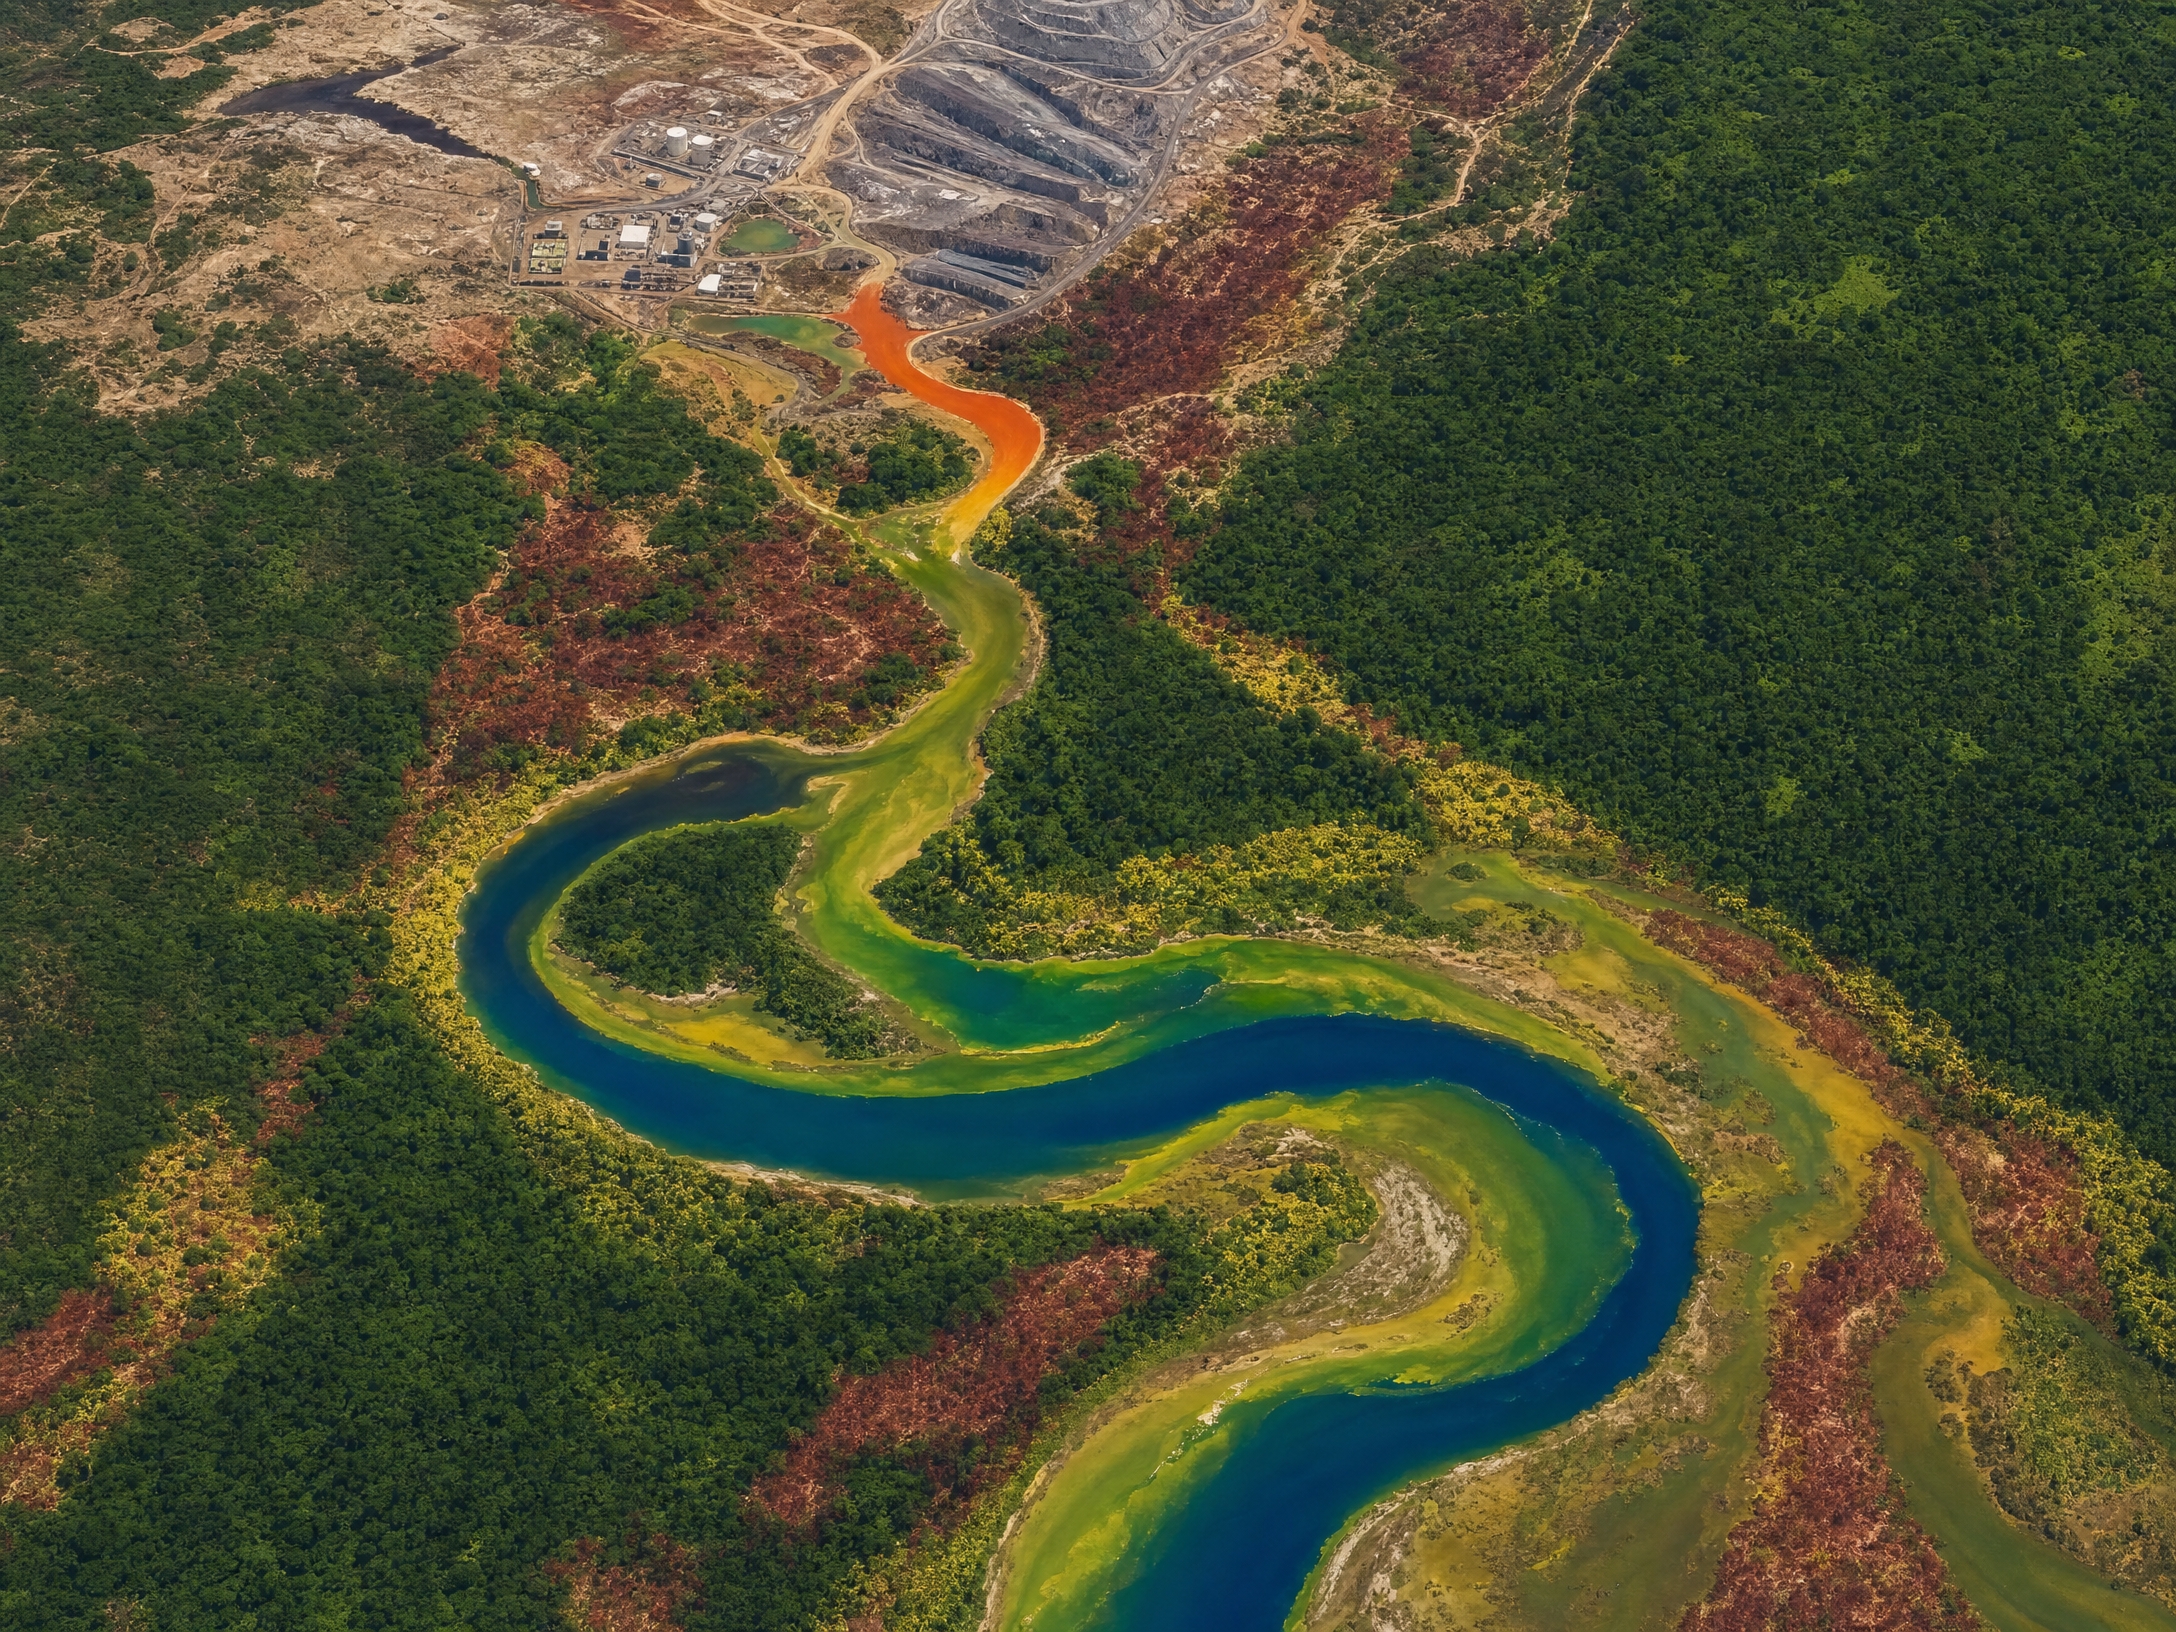
Water quality and discharge monitoring.
Calculate how much faster you could achieve bond release with objective, site-wide data.
NRM Bodies & Conservation
Threatened species population monitoring.
Habitat boundary mapping and change detection.
Invasive species early detection.
Bushfire recovery and regeneration tracking.
Wetland health assessment.
Environmental Consultants
Data layer for EIS (Environmental Impact Statements).
Baseline surveys for development approvals.
Ongoing monitoring programs for clients.
Regulatory submission data packages.
Expert witness evidence (objective, repeatable).
Government & Councils
Crown land vegetation management.
Coastal erosion monitoring programs.
Waterway health assessment.
Illegal clearing detection.
Natural disaster damage assessment.
Infrastructure & Development
Pre-construction environmental baseline surveys for road, rail, and pipeline corridors.
Ongoing offset monitoring during construction phases.
Post-construction rehabilitation evidence for approval conditions.
Vegetation management corridor monitoring (powerlines, gas pipelines).
Cumulative impact assessment across the project lifecycle.
Every major infrastructure project in Australia requires environmental offsets. We provide the evidence that conditions are being met across the entire corridor, not just sample points.
Applicable Services
Multi-spectral and Multi-sensor Inspection
High-resolution visual, photogrammetry, multispectral, hyperspectral, lidar and thermal data acquisition for vegetation mapping and health, land mapping, water quality, habitat condition, change detection, wildlife tracking and monitoring.

Digital Twins & 3D Modelling
Precision interactive 3D to 8D digital twins, terrain, bathymetric and surface models for tracking erosion and habitat changes.
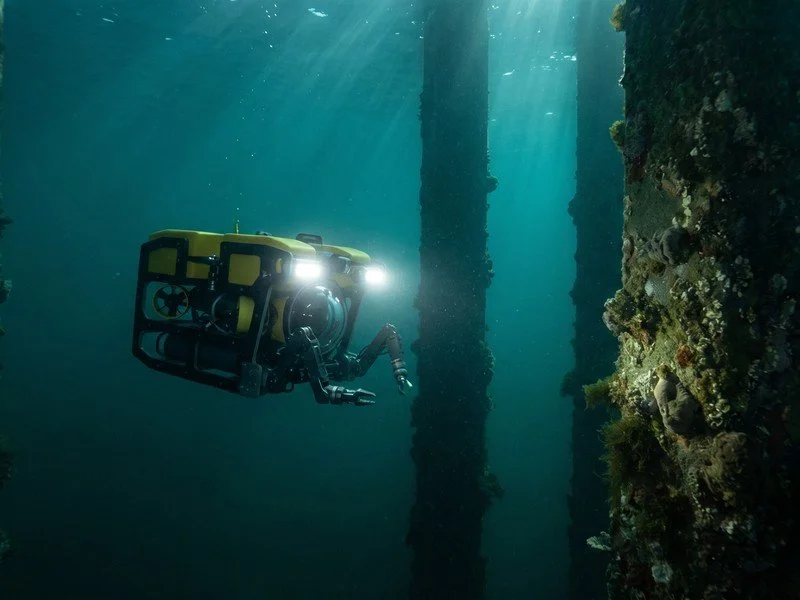
Underwater & Submerged Intelligence
Submerged inspections and mapping for assets, reef systems, marine mammals, bathymetric mapping and marine infrastructure.
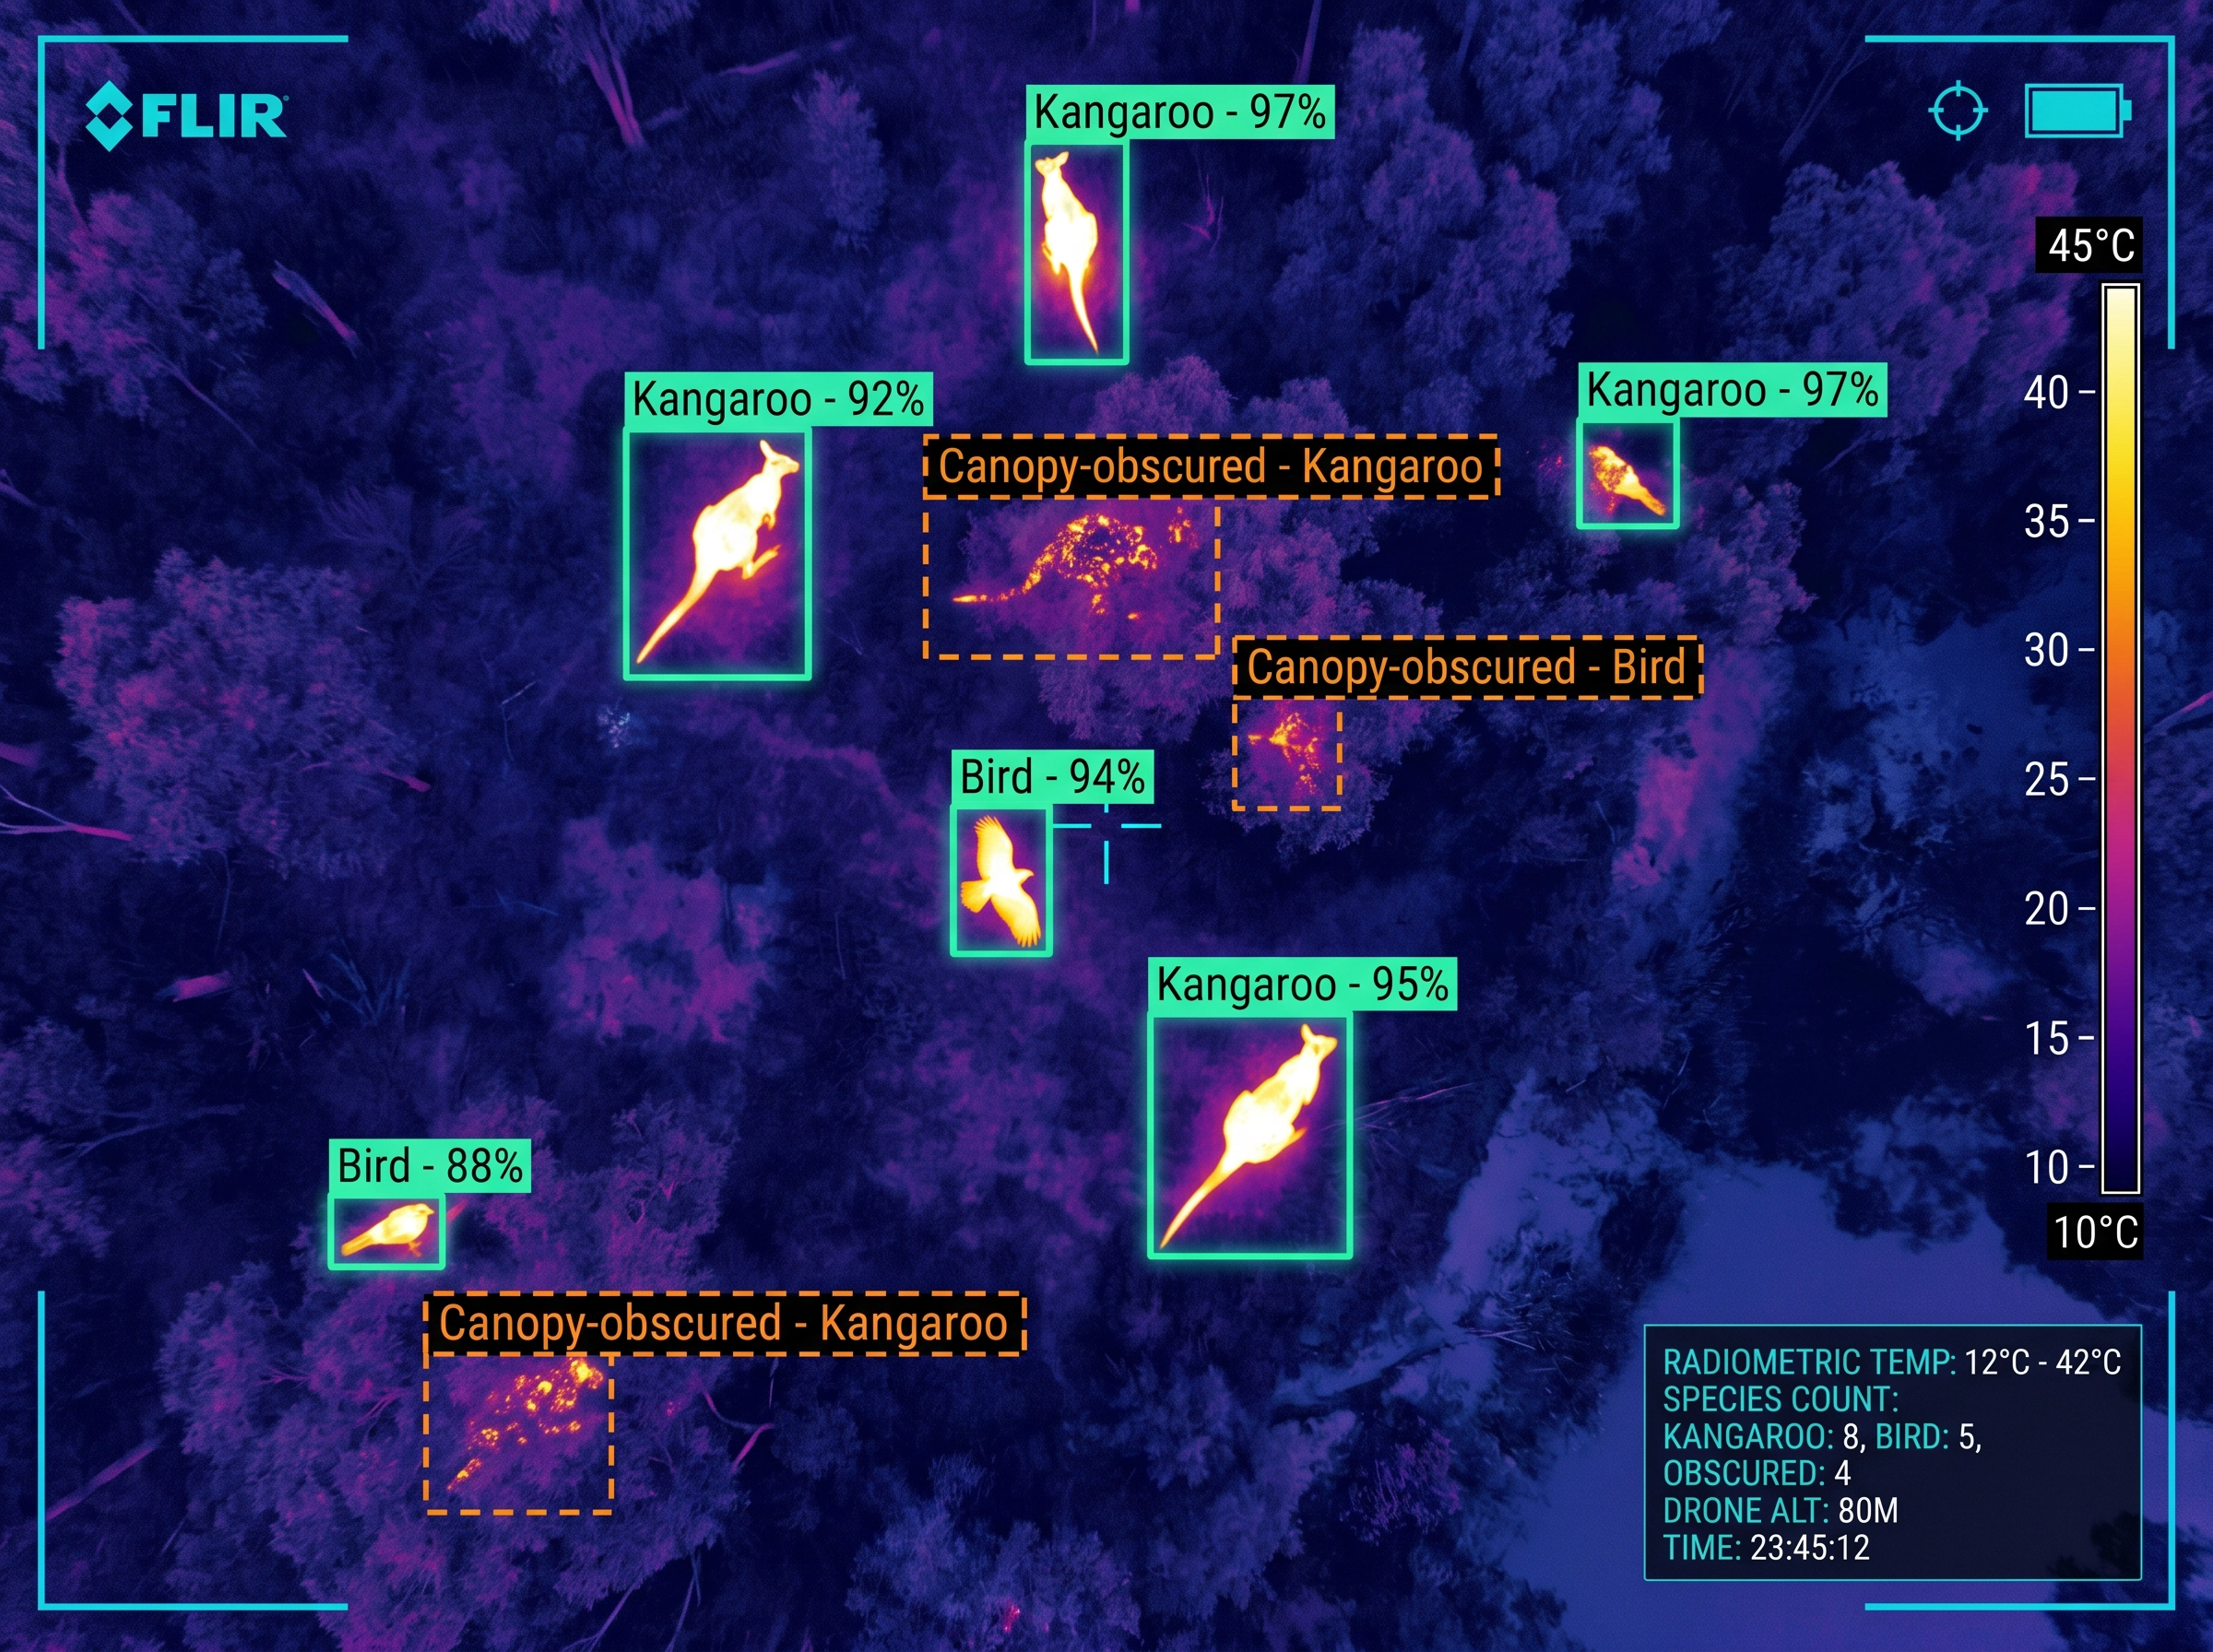
Thermal & IR Imaging
Radiometric geolocated data for wildlife tracking, monitoring, nocturnal surveys, and anomaly detection.
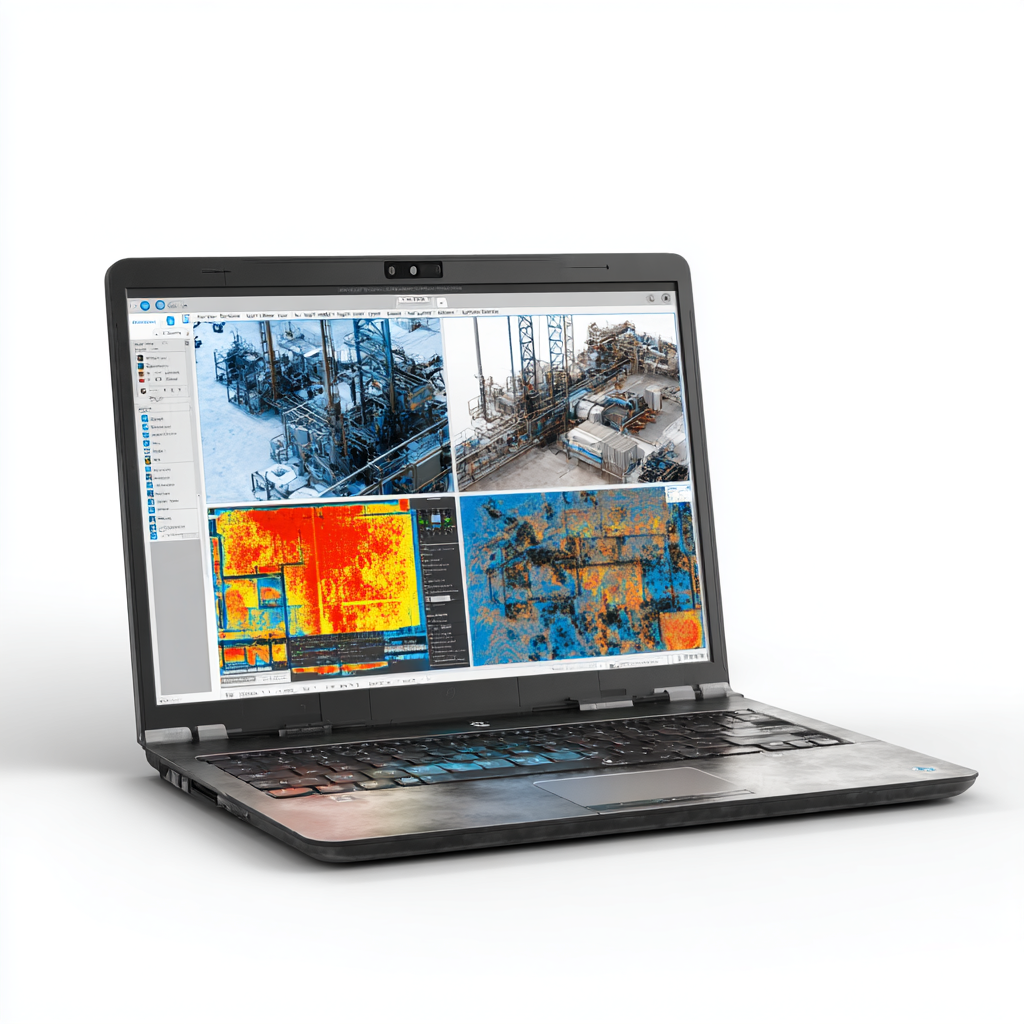
Asset monitoring programs
Long-term scheduled programs for rehabilitation sites and contaminated areas
Your Questions, Answered
How much does environmental drone monitoring cost in Australia?
Environmental drone monitoring typically costs 50-70% less than traditional field survey methods while delivering 100% site coverage versus 5-15% from ground transects. Ongoing monitoring contracts achieve 20-35% per-survey reductions through structured program pricing. Costs vary by site area, sensor requirements, and analysis complexity. Contact us for a scoping estimate based on your specific monitoring obligations.
How do drones minimise disturbance to wildlife?
We deploy low-noise enterprise platforms at optimal altitudes determined by species sensitivity guidelines. High-resolution cameras capture detailed imagery from a safe distance. Thermal sensors enable data capture in darkness without light disturbance. Zero ground contact eliminates biosecurity risks and habitat disturbance.
Can drone data be used for EPBC Act offset compliance?
Yes. We provide objective, repeatable data using high-resolution orthomosaics and multispectral imaging. By flying identical flight paths year-on-year, we create defensible visual baselines demonstrating vegetation growth, weed eradication, and habitat improvement across the entire offset area. All data is processed into your environmental digital twin for time-series comparison and delivered in GIS-ready formats compatible with regulatory submission requirements.
Can drone data support mining rehabilitation bond release?
Yes. Our LiDAR and photogrammetry services provide engineering-grade volumetric tracking of earthworks, precise erosion monitoring, and multispectral analysis of revegetation. The platform processes this into measurable 3D terrain models that demonstrate rehabilitation progress with centimetre accuracy, the robust evidence needed to support bond release applications. Rehabilitation trajectory reports predict the timeline to completion based on measured growth rates.
How accurate is drone vegetation mapping compared to satellite?
Drone-based multispectral mapping achieves 2-5cm ground sample distance (GSD), compared to 3-10m from satellite imagery, a 60-500x improvement in spatial resolution. This enables identification of individual plant stress, early-stage dieback, and weed species at the individual plant level rather than broad-area averages.
Can you track specific animal populations over time?
Yes. Thermal and visual sensors with RTK positioning establish repeatable flight paths. AI-powered detection (98.5% accuracy) enables precise population counts across multiple survey periods, tracking migration patterns, breeding success, and population health trends with scientific rigour.
What processing platform do you use for environmental data?
We operate an enterprise reality modelling and geospatial intelligence platform. Environmental data is processed through automated classification pipelines, multispectral analysis algorithms, and change detection engines. Deliverables are streamed via a browser-based 3D environment using open OGC 3D Tiles standards, enabling your team to access, measure, and compare datasets from any device without software installation.
Can you survey marine environments as well as terrestrial?
Yes. We combine aerial drone surveys with underwater ROVs for comprehensive above-and-below-water environmental assessments. Both datasets are unified into a single 3D model, one coordinate system, one timeline, one interactive viewer. Particularly valuable for reef monitoring, marine mammal surveys, coastal erosion tracking, and infrastructure impact studies.
What approvals do you hold for environmental work?
We hold a CASA commercial operators licence with advanced endorsements and additional specialist approvals enabling operations in sensitive and remote environments. We are also a Registered Suitable Operator with the Queensland Department of the Environment, Tourism, Science and Innovation. These approvals enable 10-50x greater coverage per deployment than operators with basic approvals, which is essential for vast conservation areas, remote mine sites, and time-sensitive wildlife surveys. We hold additional endorsements beyond what is listed here.
What happens to our data between surveys?
Your environmental digital twin persists between surveys. Teams can query historical data, compare any two dates, and generate compliance reports at any time via browser-based 3D viewer. When new survey data arrives, it is automatically aligned to previous epochs for change detection. The model is always available, not locked in a report that was delivered six months ago.
Can you consolidate multiple monitoring providers into one program?
Yes. We deliver aerial multispectral, thermal, LiDAR, ground-level 360, and underwater ROV in a single mobilisation. All data is processed into one unified digital twin, one coordinate system, one timeline, one report. Clients using 2-3 separate providers typically save 30-40% in duplicated mobilisation costs alone, before accounting for the value of spatially correlated data.
How do drones support bushfire recovery monitoring?
Post-bushfire, we capture multispectral imagery mapping burn severity (dNBR), identify surviving vegetation, and establish regeneration baselines. Repeat flights at 3, 6, and 12-month intervals track recovery at individual tree level. Time-series models provide quantitative evidence for land management decisions, insurance claims, and compliance reporting.
What environmental monitoring can underwater ROVs perform?
Underwater ROVs perform habitat mapping, coral health assessment, seagrass monitoring, water quality sampling, invasive species detection, and aquatic fauna surveys without disturbing the ecosystem. Unlike diver-based surveys that are limited to 30-60 minutes bottom time and create physical disturbance, ROVs can operate for 4-8 hours continuously, access depths to 500 metres, and capture consistent, repeatable transect data. The non-contact approach satisfies EPBC Act requirements for minimal environmental impact during monitoring of protected marine and freshwater habitats.
Sources
Department of Climate Change, Energy, the Environment and Water (DCCEEW), Environmental Offsets Audit Report, 2024. https://www.dcceew.gov.au/sites/default/files/documents/environmental-offsets-audit-report.pdf
DCCEEW, EPBC Act Compliance — Infringement Notices: Sojitz Blue Pty Ltd, 2026. https://www.dcceew.gov.au/environment/epbc/compliance/infringements
ABC News, McArthur River Mine $520 million rehabilitation bond, April 2023. https://www.abc.net.au/news/2023-04-21/mcarthur-river-mine-nt-rehabilitation-bond-court-decision/102246464
Government of Western Australia, Mining Rehabilitation Fund 2025 Data Release, 2025. https://www.wa.gov.au/government/publications/mining-rehabilitation-fund-2025-data-release
Norton Rose Fulbright, Understanding the EPBC Act Reforms: A Practical Guide, October 2025. https://www.nortonrosefulbright.com/en-au/knowledge/publications/40d6ce1c/understanding-the-epbc-act-reforms-a-practical-guide